Displaying Array Variables as an XY Chart
In the Cartesian XY Chart visualization element, you can visualize array variables as curves. In the case of multiple array variables, a shared X-axis and multiple Y-axes are used. The array variables to be visualized as well as the optical design of the curves are specified in a separate configuration dialog. Click the  XYChart element property to open this dialog. If the user is to be able to change the curve data at runtime, then you need to provide the appropriate visualization elements with a corresponding input configuration.
In the Control variables element property, you can enter application variables that can be used to zoom into the chart or pan the graph to another position. Based on this, you can set up an input option for the user in a corresponding visualization element at runtime.

Displaying data as a curve in the Cartesian coordinate system
Initial situation: A project is open. The application in it provides the array data PLC_PRG.DataX and PLC_PRG.DataY, which is to be displayed as a curve in the Cartesian coordinate system.
PROGRAM PLC_PRG
VAR
    DataX : ARRAY [1..200] OF REAL ;
    DataY : ARRAY [1..200] OF REAL ;
    xDoIt : BOOL := FALSE;
    ix : INT;
END_VAR
IF xDoIt THEN
    xDoIt := FALSE;
    FOR ix := 1 TO 200 BY 1 DO
        DataX[ix] := (ix * 0.2) + 0.1;
        DataY[ix] := (ix * 0.1);
    END_FOR
    xDoIt := TRUE;
END_IF
In the Devices view, add a visualization below the application. Assign the name
VisMainto the visualization.The visualization editor is open.
In the Visualization Toolbox view, select and drag the Cartesian XY Chart element to the editor.
Select the new element and open its Properties view.
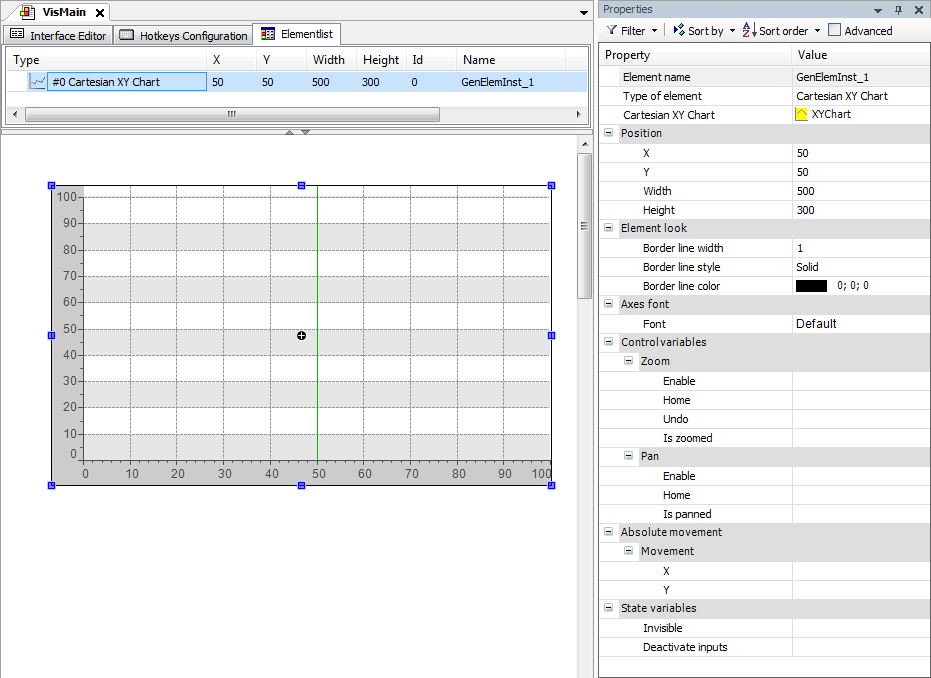
In the Cartesian XY Chart property, click the
XYChart. value.The XY Chart Configuration dialog opens. All required settings are marked with the warning
 symbol. The configuration tree shows the minimum configuration (a curve):
 Curve1[AxixY1]withAxisX(X)andAxisY1(Y).In the configuration tree, select
Curve1.The respective graph settings are now visible to the right of the configuration tree.
In the Data X, Variable setting, specify the one-dimensional variable with the horizontal data.
PLC_PRG.DataXIn the Data Y, Variable setting, specify the one-dimensional variable with the vertical data.
PLC_PRG.DataY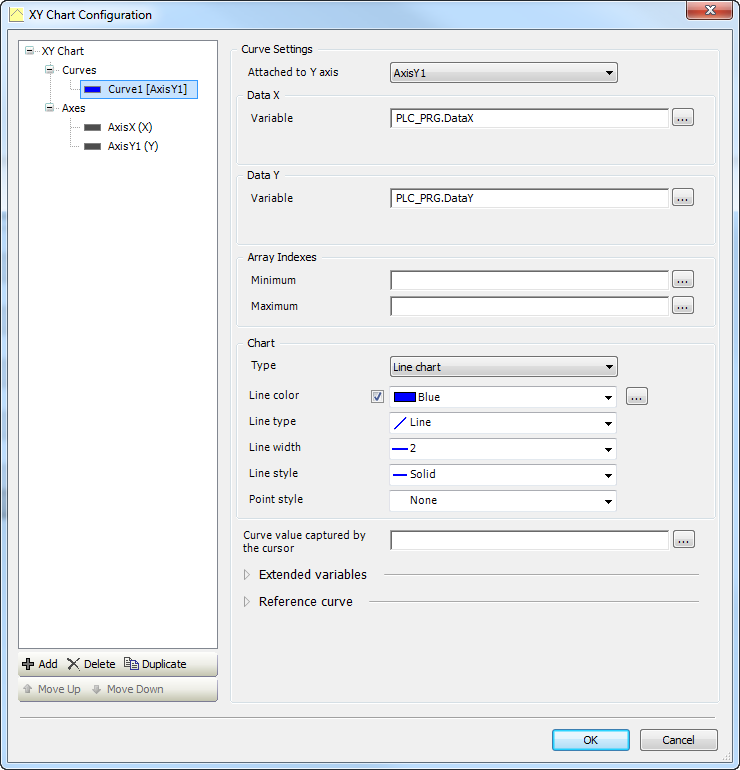
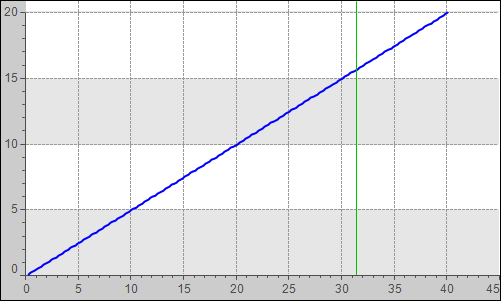
Compile, download, and start the application. Force the variable
xDoIttoTRUE.The target visualization opens.
Curve1is displayed in the Cartesian coordinate system.