Application on the PLC
Downloading the application to the PLC
Requirement: The application has been compiled without errors.
For more information, see: Debugging the application program
Click .
A dialog prompt opens to ask whether or not the application should be downloaded to the controller.
Click Yes.
The application is downloaded to the controller. The entries for the controller and the application in the Devices view are highlighted in green.
Stopappears after the Application object. The current status of the controller is displayed in the taskbar.
Starting the application
If you have followed this tutorial precisely up until now, then you can use the Application on the PLC Device (CODESYS Control Win) .
In the Devices view, in the context menu of the Application object, click Start.
The program is running. The entries for the controller and the application in the Devices view are highlighted in green.
Runappears after the Application object. The current status of the controller is displayed in the taskbar.
Monitoring and one-time writing of variable values at runtime
In the following section, you can view the "monitoring" of the variable values in the various POUs, and you can set a specific variable value on the controller one time only from CODESYS.
You can see the actual values of the application variables in the online views of the POU editors or in monitoring lists. In the example here, we will focus on monitoring in the POU editor.
Requirement: The application is running on the controller.
In the device tree, double-click the objects
PLC_PRG,Signals,Simulation, andGlob_Varto open the online views of the editors.In the declaration part of each view, the actual value of the variable (1) on the controller appears in the table of expressions in the Value column (3) (see figure).

Monitoring in the implementation part depends on the implementation language. In the case of non-Boolean variables, the value is always located in a rectangular field to the right of the identifier. In the ST editor, this also applies to Boolean variables. We call this display "Inline monitoring". In the graphical editors, the value of a Boolean variable is shown by the color of the output connecting line (black for
FALSEand blue forTRUE):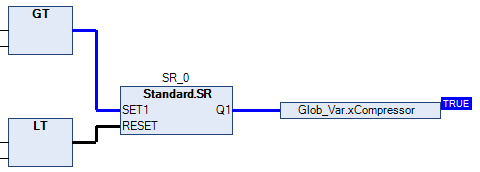
Observe how the variable values change in the various POUs. For example, you can see in the GVL
Glob_Varhow the values ofrTempActualandxCompressorchange due to the processing of the simulation program.
One-time setting of variable values on the controller:
Set the focus in the online view of the GVL
Glob_Var.To set a new specified value, double-click in the Prepared Value column (2) next to the expression
rTempSet.An input field opens.
Specify the value
9and exit the input field.To specify an open door, click once in the Prepared Value field next to the expression
xDoorOpen. The valueTRUEis specified. Click three more times to see that you can toggle the prepared value betweenTRUE,FALSE, and empty.To write the prepared value
TRUEone time only to the variable, press Ctrl+F7.The two values are each transferred to the Value column (3). Now the variable
xDoorOpenno longer changes its value and the set temperature is 9 degrees. ThetimTempvariable changes to the value1sbecause the refrigerator door is now "open" and the heating due to theSimulationshould be faster than before (2s).
Setting of breakpoints and stepping at runtime
"Debugging": For troubleshooting purposes, you need to check the variable values at certain points in the code. You can define breakpoints for the execution and initiate a step-by-step execution of the statements.
Requirement: The application has been downloaded to the controller and is running.
Double-click
Simulationto open the program in the editor.Place the cursor in the code line
iCounter := iCoutner + 1;and press F9.The
 symbol is displayed before the line of code. It indicates that a breakpoint is set on this line. The symbol changes immediately to
  . The yellow arrow always points to the next statement to be processed.
  appears in the taskbar instead of .
Observe the value of the variable
iCounterin the inline monitoring or in the declaration part of theSimulationprogram.The value of the variable no longer changes. The processing was stopped at the breakpoint.
Press F5 to restart the processing.
After one cycle, the program stops again at the breakpoint.
iCounterwas incremented by 1.Press F8 to execute the next processing step.
The RETURN at the end of the line
iCounter := iCounter + 1;statement is highlighted in yellow.Press F8 again to execute the next processing step.
The processing jumps to the editor of
PLC_PRG. Repeatedly pressing F8 shows how the program is executed step-by-step. The statement to execute is once again marked each time with a yellow arrow.To disable the breakpoint and return to normal processing, set the cursor back in the code line and press F9. Then press F5 to set the application back to
mode.
Executing a single cycle at runtime
Requirement: The application has been downloaded to the controller and is running.
As above when stepping, monitor the line
iCounter := iCounter + 1;in theSimulationprogram.Press Ctrl+F5 or click to run a single cycle.
The processing runs through one cycle and stops at the breakpoint again.
iCounterwas incremented by 1.Press Ctrl+F5 a few more times to view single cycles. Then press F5 again.
The program runs again without stopping and without forced values. The
tempvariable has the value1sagain. is displayed again in the status bar.