Using a Visualization as an Element
When you define a frame interface for a visualization and then reference the visualization, this construct behaves like a visualization element:
When creating the frame interface on the Frame Configuration tab, you can define which properties will be public. You can define the interface yourself.
You can categorize the properties and structure them hierarchically to provide for a clear overview.
When the referenced frame is selected in the visualization editor, exactly those properties are displayed in the Properties view which have been defined in the frame interface (Open Frame Configuration). When you assign values there, you will get help as usual from the editors provided in the view. The handling is the same.
If the Forward inputs standard property has been added to the frame interface, then specific user inputs will be forwarded to the referenced visualization. These mouse events are
OnMouseDownandOnMouseUp.The visualization can be reused as often as you want by referencing it using a frame in a superordinate visualization.
Configuring a frame interface
The visualization in the POUs view should represent a special measurement control named Gauge. This visualization should be reusable. When it is reused, only a few selected properties need to be configured. That is why the visualization gets a frame interface.
Double-click the
Gaugevisualization object.Gaugeis displayed in the visualization editor. The Frame Configuration tab is displayed in the top part. The properties for the frame interface are defined there.Focus on the frame configuration and click the Add node command.
The new node has the default name Property and has to be configured now.
Double-click the new property in the first column and specify a suitable name, such as
Max.Double-click the new property in the Editor Type column and select Variable.
Double-click the new property in the Variable Type column and select
INT.Double-click the new property in the Default Value column and select
250.Double-click the new property in the Variable column and select
iIn.The property is linked to the interface variable
iIn.
The new node is configured.
Add a new
VisGaugevisualization below your application.Drag a Frame element to this visualization.
The Frame Configuration dialog opens.
Add the
Gaugevisualization to the Selected visualizations.Gaugeis displayed in the superordinateVisGaugevisualization. In the Properties view, the properties are displayed as defined on the Frame Configuration tab.Figure 3.VisGaugevisualization used as an element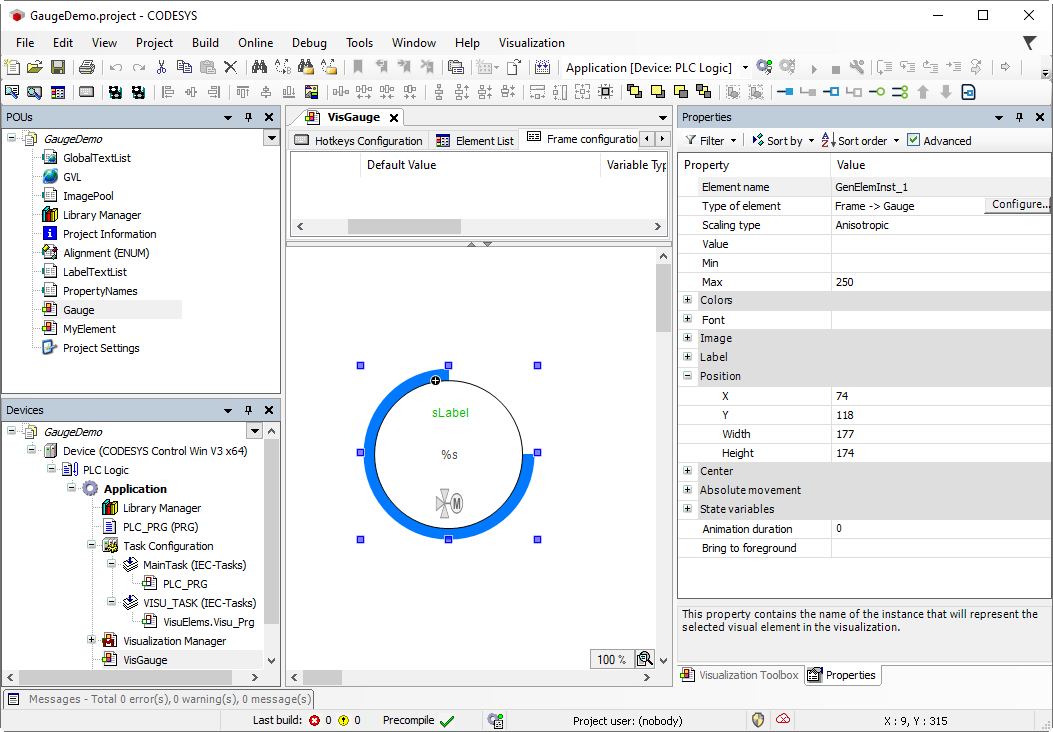
Configuring descriptions
Managing texts in text lists helps you to localize them and keep track of them.
To support the application developer, descriptive texts for the interface can be configured both for the entire visualization and for each interface property. The texts are automatically managed in text lists.
In the frame configuration, you can assign the IDs of the text lists in the Description ID column. Alternatively, you could also enter a text directly in the Default Value column. The requirement for this is that the field in the Description ID column is empty. As a result, localization is not possible.
The descriptions are displayed when the application developer selects the referencing frame element in a superordinate visualization. Then, depending on the selected property, the corresponding text appears in the comment window in the Properties view.
Gauge visualization and its propertiesIn the POUs view, add a text list named
PropertyNames.Configure an ID for each property which should output a comment:
Click in the blank line of the text list. Open the line editor under the ID column and enter an ID.
Configure a default value for the new ID and localize this value for each language.
The text list is prepared. The texts are referenceable.
Example: Text list with descriptions for the interface
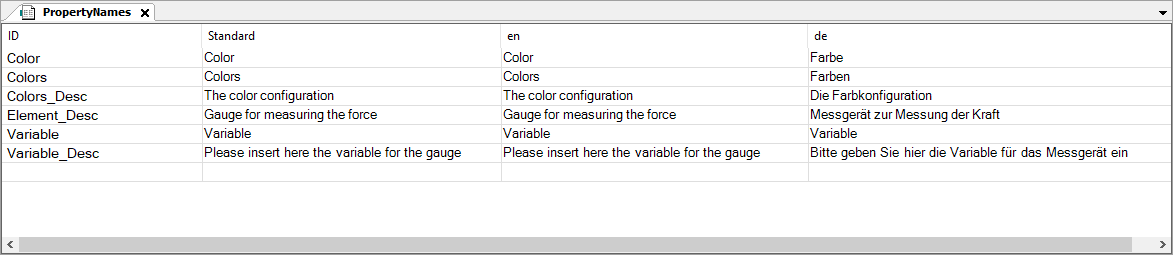
The text with the ID
Element_Descis the element description of theGaugevisualization. The intended use or function is usually specified here.Switch to the visualization where the texts should be referenced. Make sure that the top part is visible and click the Frame Configuration tab.
The
Gaugevisualization with the frame configuration above is active.In the toolbar, click the
 command icon.
Tip
If the command is not available, then this is because an element description already exists in the frame configuration. Note that only one description is allowed per frame configuration.
The Element description entry is inserted at the top position.
Configure the entry:
In the row, click the field in the Description ID column.
The line editor opens and brings the
 button to the Input Assistant.
Open the Input Assistant.
Select the
PropertyNamestext list there and then select the IDElement_Desc. Click OK to close the Input Assistant.Press the Enter key to confirm your selection.
The description ID is assigned a text list ID. The selected text is automatically displayed below Default Value. This field is no longer editable.
The interface now has an element description.
In the frame configuration, assign a description ID for each property in the Description ID column. Continue as described in the Step 3 step.
Each interface property now has a description.
Reference
Gaugein another, superordinate visualization.Switch to the Visualization Toolbox view.
Click the Current Project button.
Drag the
Gaugevisualization to the visualization editor.In the Properties view, the interface properties are displayed as configured.
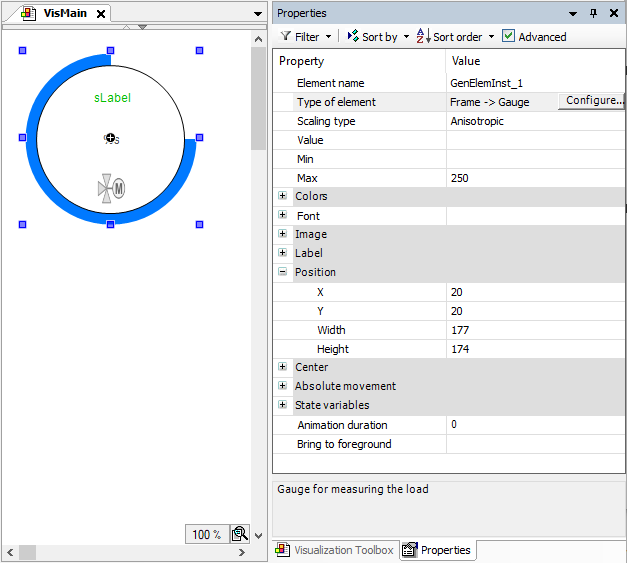
Select the element properties one after the other.
The respective texts are displayed in the comment below it. In the case of the Type of element property, for example, the element description is displayed.
Figure 4. ReferencedGaugevisualization inVisMain