Online Mode
At runtime, you can monitor and control the behavior of the diagram in the monitoring in the editor.
Tip
The sample project UML_SC_CoffeeMachine.project is provided to illustrate the following examples.
Time behavior of a transition
Statecharts react to events. When an event occurs and as a result a condition is true, a state transition occurs with the next bus cycle clock. You can also configure transitions so that the state transition switches edge-triggered with the corresponding condition. In the implementation, the transition is then flagged with the  symbol.
In the view, select the Rising edge option.
Time behavior of a state
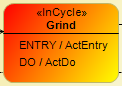
At runtime of a statechart, its states are usually executed with the task cycle. However, you can configure a state in such a way that it is executed in-cycle and the state quickly executes all actions within one bus cycle. This kind of state is displayed in red in the implementation.
In the case of functions and methods, the local variables are usually temporary. At runtime, the local variables are not stored, but released, when the POU is exited. As a result, the information about the state of the statechart is not stored. Therefore, a switching behavior controlled by the bus cycle is not possible. For this reason, statecharts in functions or methods are executed in-cycle. So if you implement a method as a statechart, then this diagram is switched quickly. Also in the ToolBox view, only a  red state is available.
You can prevent this behavior by declaring instance variables VAR_INST instead of local variables in the function or method. When you exit the method, instance variables are stored in the calling POU (a program or a function block instance). The state transitions are then switched slowly edge-controlled with the bus cycle.
Tip
The requirement for this is that the Stateful implementation option is selected in the Properties dialog on the UML tab.
Monitoring and forcing
When an application has been downloaded and started, you can monitor its POUs in the monitoring. In the case of POUs in the UML Statechart implementation language, you can graphically monitor which state is active, because the currently active state is marked in blue. The statechart is updated continuously.
You can force variables in the declaration in the Prepared Value column. In the case of Boolean variables, you can also click the monitoring value to do this in the implementation. When a value is prepared, the monitoring value is marked in the upper right corner of the implementation.
You can also monitor the condition variables of transitions in watch lists in online mode.
Download and start the application of the sample project
UML_SC_CoffeeMachine.project.The application is executed.
Open the editor of the
KaffeemaschinePOU, which was implemented as a UML statechart.The state that is displayed in blue is the current active state of the POU.
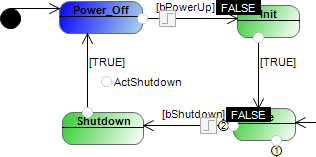
In the statechart, click the value of the variable
bPowerUp.In the declaration, the value
FALSEis prepared for this variable in the Prepared value column. In the implementation, the monitoring value is flagged with a blue corner.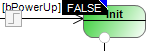
Click (Ctrl+F7).
The transition
bPowerUpisTRUE. The statechart switches to the stateIdle.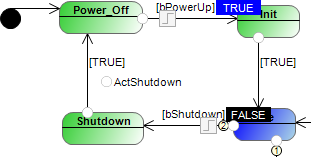
Click the variable
bPowerUp.A context menu opens.
Click Add Watch.
In the Watch List 1 view, the variable
Coffeemaker.bPowerUpis listed with its context
Breakpoints
In the statechart in online mode, you can define breakpoints to halt the execution of the application at these points and to check the variables or watch lists there. In the statechart in online mode, all possible breakpoint positions are displayed as a  gray circle. You can click the circle to select and deselect a position. Click or press the F9 key to define a selected position as a breakpoint or release it.
In addition, you can resume an application halted at a breakpoint in single steps.
- : Possible position
 : Selected position
 : Enabled breakpoint
 : Disabled breakpoint
 : Execution stop at breakpoint In addition, the associated state or transition is marked in yellow.
Download and start the application of the sample project
UML_SC_CoffeeMachine.project.The application is executed.
Open the editor of the
KaffeemaschinePOU, which was implemented as a UML statechart.Possible breakpoint positions are marked with a
light gray circle.Click a
circle.The position is selected:
.Click .
Alternative: F9
The position is activated as a breakpoint:
. When the position is reached during execution, the application halts and the position changes to yellow.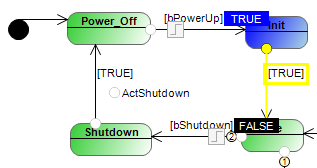
Tip
For general information about breakpoints, see: Using Breakpoints
Online change
If you do offline editing on an existing statechart, such as changing transitions, conditions, priorities, actions, or names, then you can download the diagram to the controller with an online change when you log in. The diagram does not require reinitialization.
However, when you add, remove, or replace a state or region, the diagram does require reinitialization. This also applies to changes to implicit states, such as the Selection element or if you select the Abortable implementation condition in the properties dialog of a statechart. Then log in to the controller with a download.