Example: Cartesian XY Chart
Product: CODESYS Visualization
This example shows which display options you have with the Cartesian XY Chart visualization element. And how to configure the element to graphically display the history of array values as a line or bar chart in the Cartesian coordinate system.
Description
In this sample project, the Cartesian XY Chart visualization element is used as an example.
The following topics will be covered in one application each:
Overlapping curves
Programming of curves
Zooming and panning
Additional information
Project XYChartCurvesOverlapping
You can use the overlap feature as follows.
XYChartCurvesOverlapping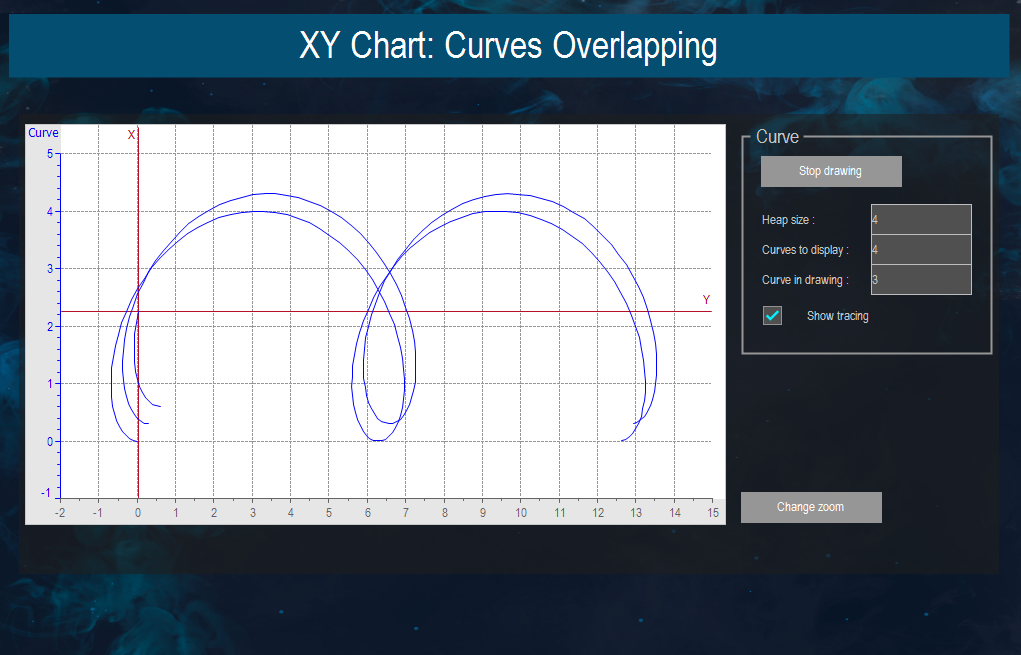
Project: XYChartProgrammingMode
You can use the programming mode as follows.
XYChartProgrammingMode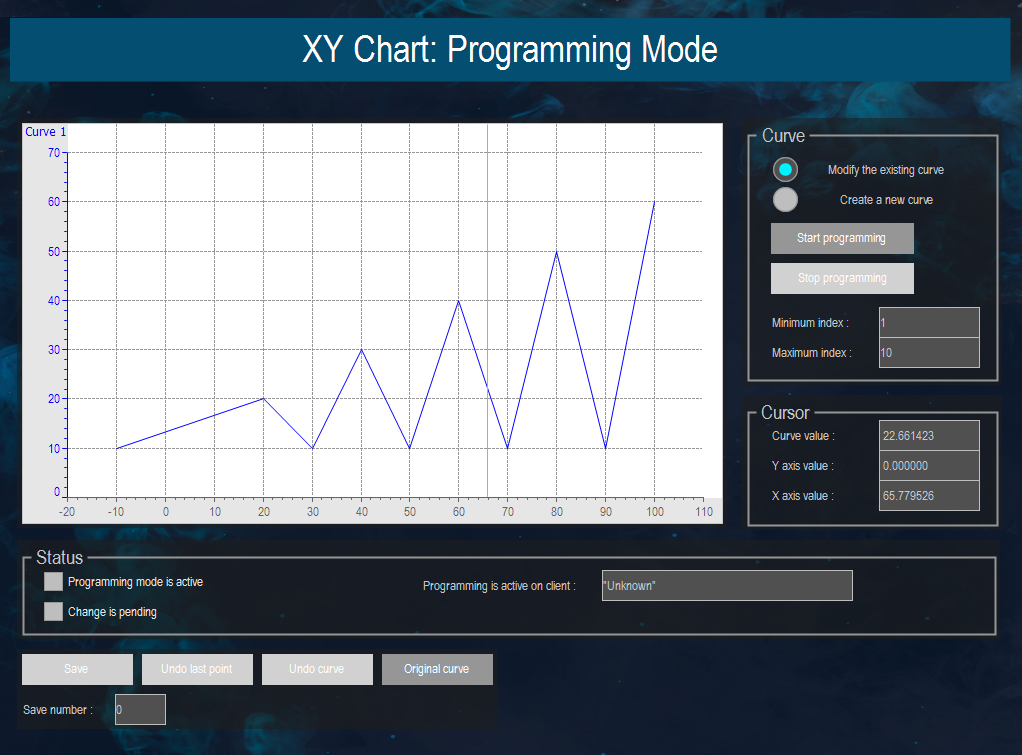 |
Sample project: XYChartZoomingPanning
You to use the zoom and pan function as follows.
XYChartZoomingPanning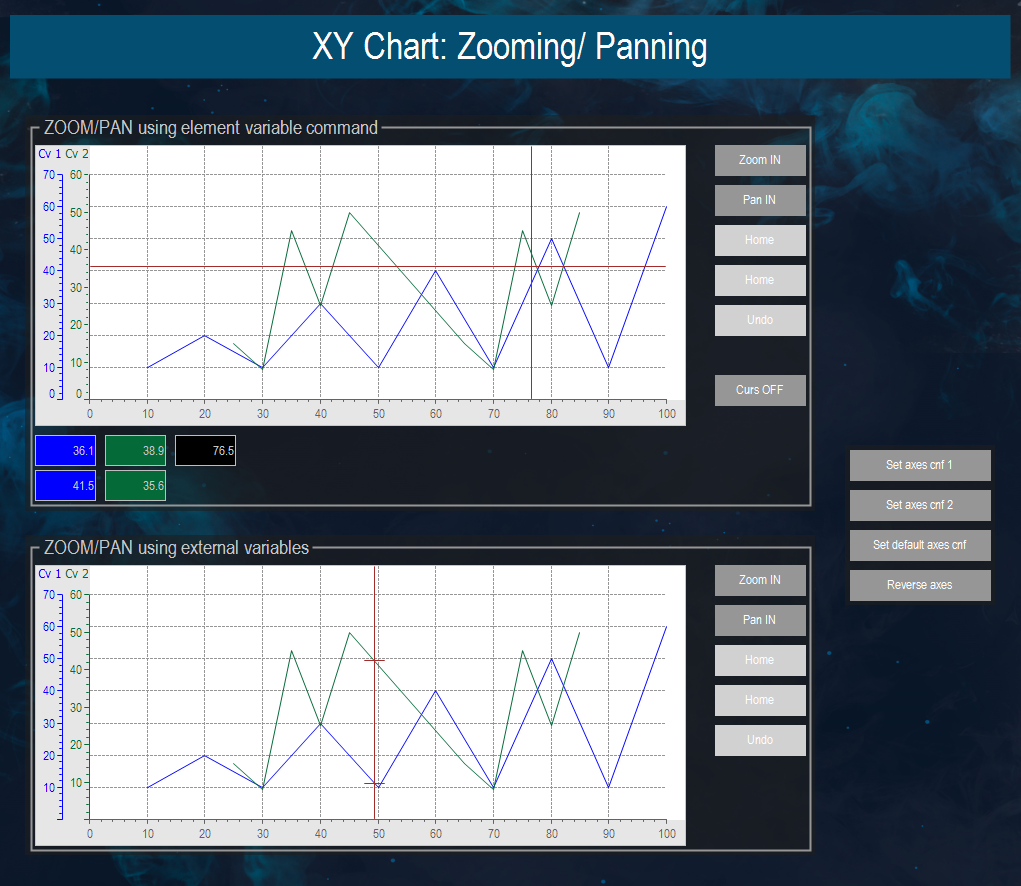 |
System requirements and restrictions
Programming system | CODESYS Development System (version 3.5.14.0 or higher) |
Runtime system | CODESYS Control Win (version 3.5.14.0) |
Add-on components | - |
Note
 DOWNLOAD Project