The safety runtime shows timing errors in the log file.
Preparations:
You are running a CODESYS Safe Control SL or CODESYS Virtual Safe Control SL combined with the CODESYS Safe Time Provider.
Troubleshooting
If you encounter problems reported by the CODESYS Safe Control SL runtime environment and mention timing issues (from the CmpSIL3 component), then you may have timing issues in the safe time network which you should investigate.
#### Exception: ID: 0x40000066 <p0>0xb633</p0> <p1>0xbcdd</p1> <p2>0xbce1</p2> <p3>0xb2fd</p3> <p4>0x0</p4>
0x40000065: Exception channel x: Plausibility check of the local timestamp for the cycle time0x40000066: Exception channel x: Plausibility check of the remote timestamp to the cycle time0x40000067: Exception channel x: Plausibility check of the remote timestamp to the local timestamp
Note
The safe time network (between the CODESYS Safe Time Provider and the CODESYS Safe Control runtime environment) has the same high requirements for stability and real-time as a fieldbus network (for example, EtherCAT or Profinet).
Tracing with tcpdump
You can easily create a trace on the Linux command line using the tcpdump tool. If you are already familiar with Wireshark or a hardware trace device, then you can also use it to create a trace.
Determine the network adapter you want to trace.
Find out what you want to trace (contents, package type, log, etc.) in order to make the trace smaller.
Useful commands
Install tcpdump (depending on your distribution / software package management)
For example, Debian/Ubuntu "apt"-based:
sudo apt install tcpdumpRed Hat-"yum/dnf"-based:
sudo yum install tcpdump
You can see all available network adapters which tcpdump can monitor:
> tcpdump -D
1.eno1 [Up, Running, Connected]
2.any (Pseudo-device that captures on all interfaces) [Up, Running]
3.lo [Up, Running, Loopback]
Note
It is possible to run tcpdump as a normal user. If you want to do this, then read the tcpdump documentation for more details.
tcpdump command-line arguments
Details about all possible commands with tcpdump can be found in the tcpdump man page: https://www.tcpdump.org/manpages/tcpdump.1.html
Or call tcpdump:
> tcpdump --help

tcpdump version 4.99.3
libpcap version 1.10.3 (with TPACKET_V3)
OpenSSL 3.0.15 3 Sep 2024
Usage: tcpdump [-AbdDefhHIJKlLnNOpqStuUvxX#] [ -B size ] [ -c count ] [--count]
                [ -C file_size ] [ -E algo:secret ] [ -F file ] [ -G seconds ]
                [ -i interface ] [ --immediate-mode ] [ -j tstamptype ]
                [ -M secret ] [ --number ] [ --print ] [ -Q in|out|inout ]
                [ -r file ] [ -s snaplen ] [ -T type ] [ --version ]
                [ -V file ] [ -w file ] [ -W filecount ] [ -y datalinktype ]
                [ --time-stamp-precision precision ] [ --micro ] [ --nano ]
                [ -z postrotate-command ] [ -Z user ] [ expression ]
Flag (short/long) | Description |
|---|---|
| Returns the list of network interfaces which are available on the system and where the |
| Queries the interface and returns the following information:
|
| Terminates the query after receiving or reading a number of |
| Prevents the conversion of addresses (host addresses, port numbers, etc.) into names |
| Outputs each packet (minus its link-level header) in ASCII |
| When parsing, in addition to the headers of each packet, prints the data of each packet (minus the link-level headers) in hexadecimal |
| Uses |
| Writes the raw data packets to a file instead of analyzing and printing them |
| Prevents the output of a timestamp in each dump line |
| Returns the timestamp, as seconds since January 1, 1970, 00:00:00, UTC, and fractions of a second since that time, in each dump line |
| Prints a delta (microsecond or nanosecond resolution, depending on the |
| Prints a timestamp, as hours, minutes, seconds and fractions of a second since midnight, on each dump line. The output is preceded by the date. |
| Outputs additional information (verbose) |
Tracing the package
Simple capture and output on the console:
> sudo tcpdump -i <interfacename>

# e.g. with interface "eno1":
> sudo tcpdump -i eno1
Capture and output as a Wireshark-compatible file
> sudo tcpdump -i <interfacename> -w <file>

# e.g.
> sudo tcpdump -i eno1 -w myfirsttrace.pcap
Then the file myfirsttrace.pcap can be opened in Wireshark. (.pcap is the default file extension for Wireshark trace files.)
> sudo tcpdump -i eno1 -w myfirsttrace.cap -s 200 udp port 60000
Investigation / Analysis
Record the trace on the host of the Safe Control SL (receiving side of the timeprovider communication), as shown in the example above.
Then open the *.pcap file with Wireshark. It will look like similar to this:
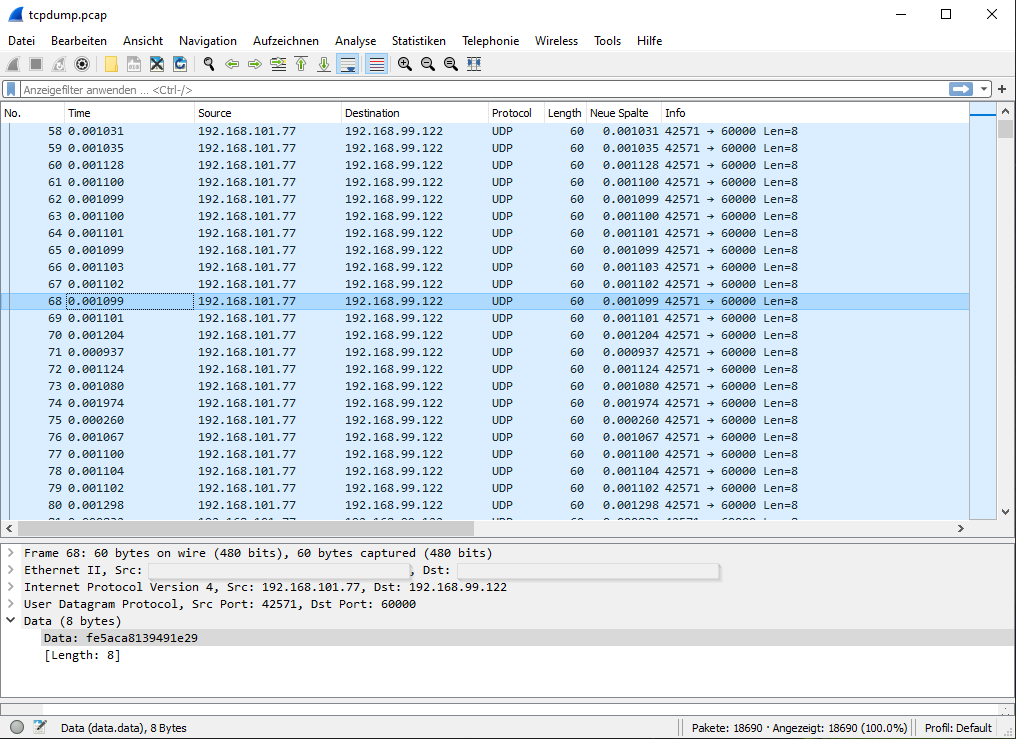
You will notice that the packages are normally sent with an interval of 1 millisecond (the time difference between the package). (See packet number 58 and following.)
A typical problematic situation in which CODESYS Safe Control SL will issue an exception / problem due to timing can be seen in packet number 74: This packet is received ~2 ms after the previous packet, so the delay is ~1 ms. This is not acceptable for CODESYS Safe Control SL as a reliable and real-time-capable timestamp.
. Actions to reduce the delayFind out whether the problem is visible on the receiving or sending side. You must consider both the receiving side (CODESYS Safe Control Host) and the sending side (CODESYS Safe Time Provider Host).
Improve the real-time capabilities and robustness of this timestamp communication in general. You can do this by removing other interfering communication and load from this network (use exclusively for safe timestamps).
Improve the sending and receiving performance by configuring the process priority of the corresponding IRQ (of the network driver).
If you cannot improve any further and if your safety process allows it, you can increase the cycle time of the CODESYS Safe Time Provider (sending the timestamp).