The memory consumption of my IEC application is increasing.
Preparations:
You need a runtime system in which the CmpMemGC component is enabled and active. You can check whether this component is loaded in the runtime log.
Troubleshooting
If you notice strange effects after a certain operating time of your IEC application (such as the loss of the license status or that no new memory can be allocated), then this could be caused by a memory leak.
You should investigate these effects and find the source of the problem.
CODESYS Memory DeviceTrace
This function is available in runtime systems version SP19 (SL version 4.9.0.0) and higher. It can be used very easily:
Enable the setting in the runtime environment.
Stop the runtime via the Deploy Tool.
Connect to your target system via
puttyor another SSH client.Open the configuration file of the runtime environment with a text editor (for example, nano):
sudo nano /etc/codesyscontrol/CODESYSControl.cfg
In the
CmpMemGCsection, add the entryEnableMemTrace=1.[CmpMemGC] EnableMemTrace=1
Save and close the file.
Restart the runtime via the Deploy Tool.
Add the device trace to your CODESYS project (where this problem occurs).
In the device tree, right-click the device.
Click Add Object → Device Trace.
The DeviceTrace object is inserted below the controller.
The Device Trace tab is displayed.
Click the Trace → Upload Trace command.
The Online Traces of device 'CODESYS_Control_for_Linux_SL' dialog opens.
If you cannot find the MemGCTrace entry, then the setting from Step 1 is not set correctly. If your controller does not support the mechanism, then use one of the following two options for diagnosis.
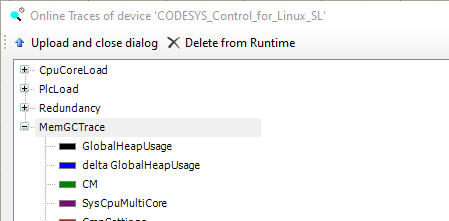
Select the MemGCTrace entry and click Upload and close dialog.
The memory trace (
MemGCTrace) is added to theDeviceTrace.
For more information, see: Command: Upload Trace
CODESYS Library: SysMem
You can also access internal information programmatically. You can access the current overview of all allocated RAM / heap memory via IEC library functions.
SysMem.SysMemGetCurrentHeapSize()
This value can be used to observe the current heap size. You can watch this value or write it to a trace.
This may help you to determine if the increase in allocated memory is time-based with certain other events in your IEC application.
Linux command line
If you have access to the Linux console (for example, via an SSH client), then you can also check the memory behavior.
There are various tools and commands to achieve this:
htop / top
These are graphical tools to analyze the processes (and threads) on a Linux system.
Almost all Linux distributions provide these tools, so you can easily install them via apt or dnf or the package management of the distribution.
htop
# or
top
Both tools can be used to see the threads in a tree view and to analyze the CODESYS runtime process and its threads. Each IEC task is a pthread within the runtime process.
In the htop tool, you can customize the view via F2 (setup menu): We recommend that you enable the Tree view and Show custom thread names options.
In the upper area, you can enable the tree view with the key combination Shift + V and therefore see the CPU usage / memory usage per thread. This may help you to determine if the increase in allocated memory is time-based with certain other events in your IEC application, or whether you have a memory leak at all.