Optimally Adjusting the Position and Size
You can design the position and size of contents in a visualization depending on their usage in container elements (Frame or Tabs). To do this, the automatically generated Container variable is used to pass the size of the container to the subordinate or referenced visualization. As a result, a visualization has access to the size of the superordinate elements and objects both offline and at runtime. This allows you to configure visualizations so that the available area is calculated and optimally filled with each change. This also applies to elements placed inside it.
These variables are helpful when, for example, you are developing a visualization for libraries that varies in position and size depending on which superordinate visualization the library visualization is called from.
Generated variables:
Container.WidthCurrent width of the container element. This is the maximum width which an element itself can fill.
Container.HeightCurrent height of the container element. This is the maximum height which an element itself can fill.
Visu.WidthCurrent width of the visualization in which the element that should be optimally positioned is located
Visu.HeightCurrent height of the visualization in which the element that should be optimally positioned is located
VisuElems.CurrentClient.WidthCurrent width of the client (client size) for use in visualization elements
VisuElems.CurrentClient.HeightCurrent height of the client (client size) for use in visualization elements
For more information, see: Access to the client size
Note
The Visu and Container variables are generated only when the Use visualization and container size properties option is selected. For new projects, the option is selected by default.
For more information, see: Properties
Configuring an optimally adapting position
In the following section, the optimal position is calculated in the Absolute movement and Relative movement property with Container.Width - Visu.Width. It is interesting to note that depending on where the generated variables are inserted, the behavior of the adapted elements varies.
Create a visualization as usual. This is typically used as a template so that it can be reused by superordinate visualizations as often as desired.
Visualization:
TemplateMake sure that the automatic generation of variables is enabled.
In the navigator, open the context menu of the visualization and select the Properties command.
The dialog opens.
Click the Visualization tab and select the Use visualization and container size properties option if necessary.
Add elements to your visualization and position them within the visualization area.
Note: An element which has the Absolute movement or Relative movement property can be configured there with the automatically generated variables. Then the element will position itself dynamically.
Important: If you add another container element in the reusable visualization, then you should set its scaling type to Fixed.
The initial size is set under Position in the Properties view.
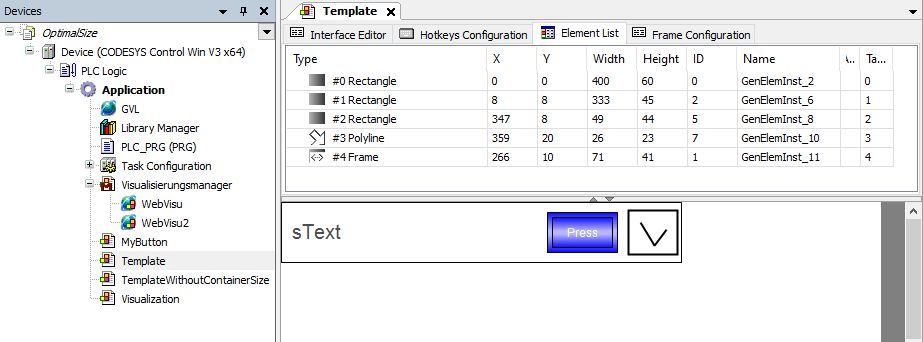
The visualization with its elements is displayed in the editor:
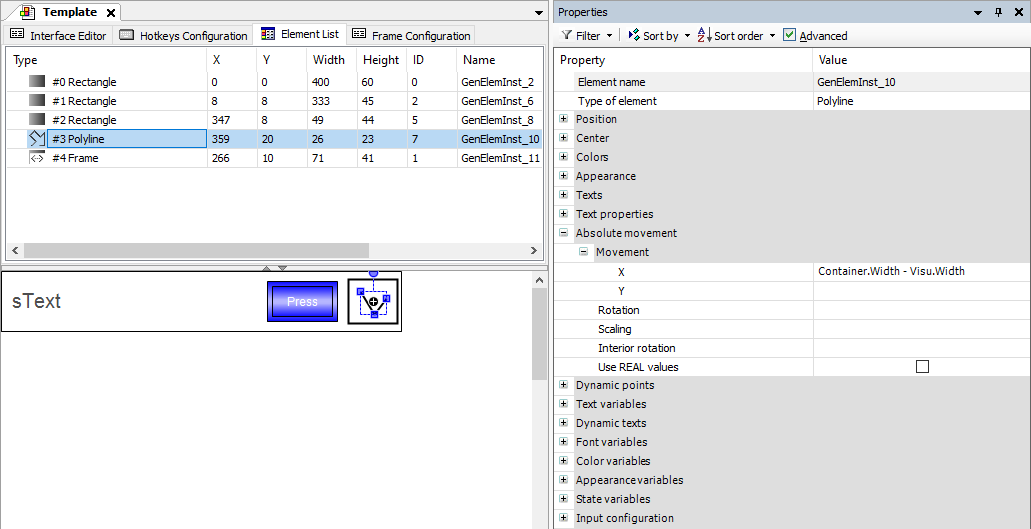
Configure the elements which should behave optimized in the Absolute movement or Relative movement properties with the generated variables. Note the differences in configuration, each of which results in different behavior for the element.
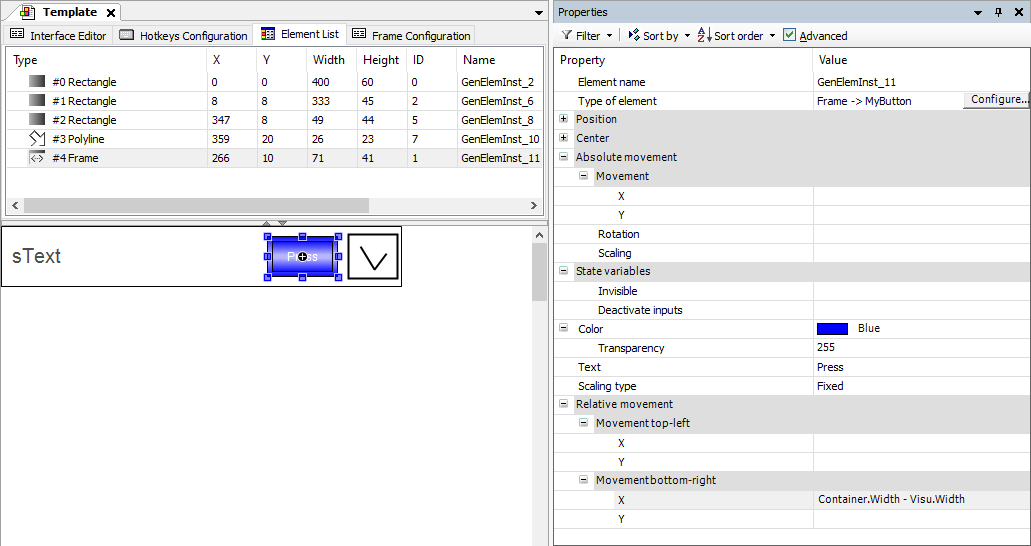
Configure the property Absolute movement, Movement top-left:
X with
Container.Width - Visu.Widthin order to move the element horizontally as a whole unit.Y with
Container.Height - Visu.Heightin order to move the element vertically as a whole unit.Configure the property Relative movement with Movement bottom-right:
X with
Container.Width - Visu.Widthin order to move the lower right corner of the element horizontally. This causes the element to adjust in shape and fill accordingly.YwithContainer.Height - Visu.Heightin order to move the lower right corner of the element vertically. This causes the element to adjust in shape and fill accordingly.
Configuration in Properties
Frame
Rectangle

Polyline
Add another visualization to your application to be the superordinate visualization. Use a container element (such as Frame) to reference other visualizations from the application, project, or libraries.
Drag the container element to the visualization and select the
Templatetemplate visualization from the available visualizations.Important: In the properties of the frame, set the scaling type to Fixed.
Slide the size of the container element to the desired size.
The elements in the referenced visualization, which have been configured with variable movement properties, automatically follow the container size (offline behavior).
Add a WebVisu below the Visualization Manager and configure it as follows:
Select the Visualization Manager and click Add Object → WebVisu.
In the editor, select the Scaling Options as Isotropic.
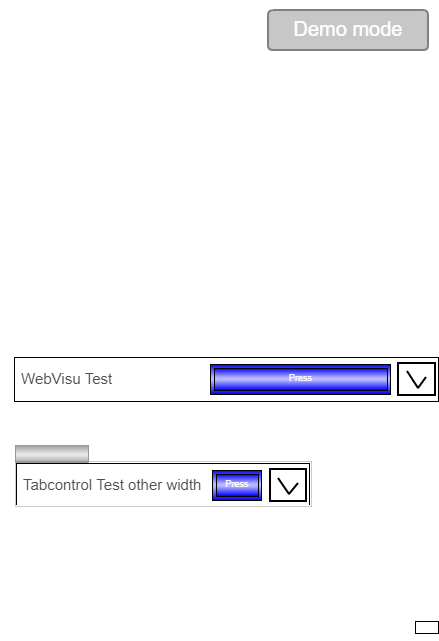
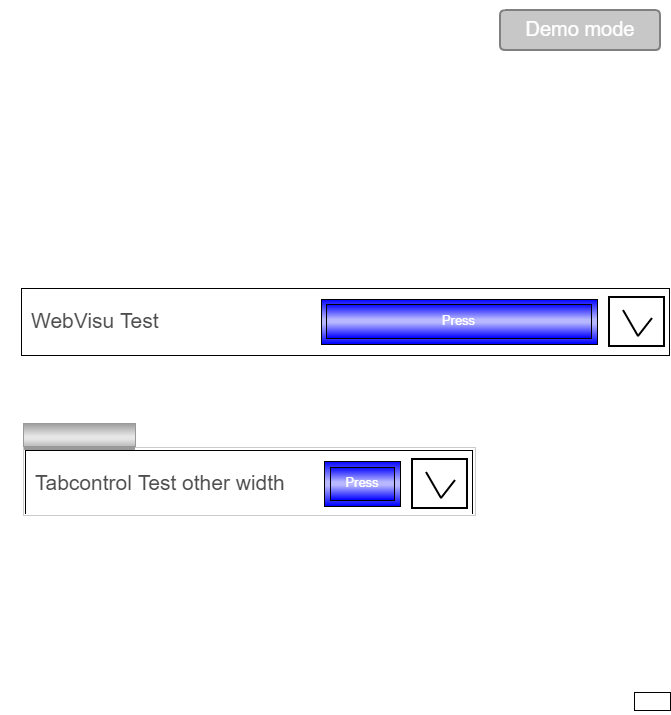
If you drag the container element wider in the visualization editor, then the dependent configured elements will adapt. In the process, the rectangle moves with the polyline as a unit. The Press button moves its right edge and is displayed as solid.
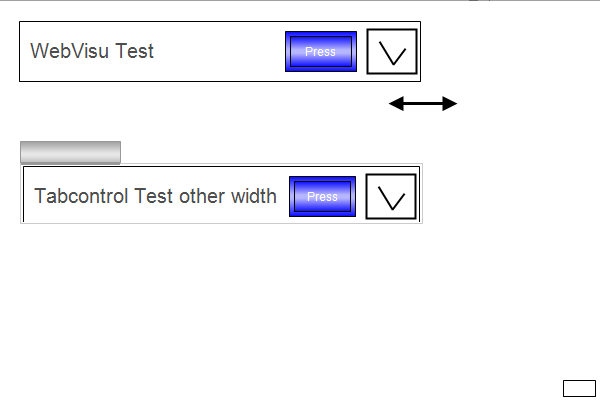
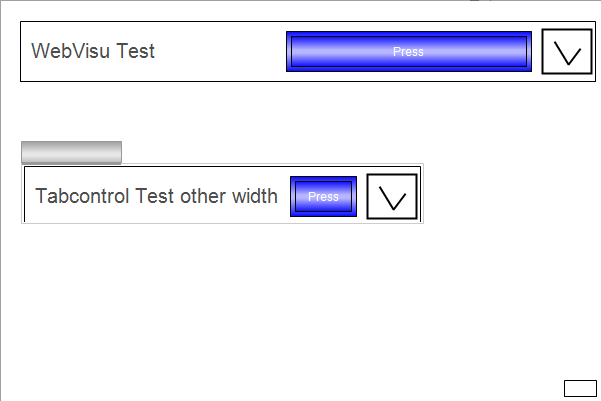
The example is displayed in the browser on areas of different sizes.