Dialog: Display Settings
Function: Configuration for the display settings of the trace diagram (for both the X-axis and Y-axis) and provides a preview in the trace diagram
Call: Display button in the Trace Configuration dialog
Add Y-Axis | Extends the trace diagram by one Y-axis Result: The Trace Configuration dialog contains an extended selection of Y-axes in the Additional axes option of the variable settings. |
Delete Y-axis | Deletes the Y-axis of the visible tab. |
Tab: X Axis
Display Mode | . Scaling
|
Minimum | Initial value of the segment Requirement: The Display Mode is Fixed. |
Maximum | End value of the segment Requirement: The Display Mode is Fixed. |
Length | Constant length of the segment |
Grid |
Select the line color from the list box of colors. |

Fixed spacing |
|
Distance | Distance between tick marks |
Subdivisions | Number of subdivisions between two tick marks |
Font | Font for the X-axis |
Tab: Y axis
Display Mode | . Scaling
|
Minimum | Literal, variable (integer data type), or constant variable (integer data type) for the initial value of the segment Requirement: The Display Mode is Fixed. Examples: NoteThe variable has to have an initial value. This is important for the offline display and the scaling subdivision. Example: |
Maximum | Literal, variable (integer data type), or constant variable (integer data type) for the end value of the segment Requirement: The Display Mode is Fixed. Examples: NoteThe variable has to have an initial value. This is important for the offline display and the scaling subdivision. Example: |
Grid |
Select the line color from the list box of colors. |
Label |
|
Fixed spacing |
|
Distance | Distance between tick marks |
Subdivisions | Number of subdivisions between two tick marks |
Font | Font for the Y-axis |
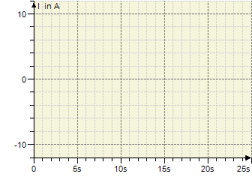
Preview of the trace diagram
Background color |
|
Reset | All settings are reset to the defaults. |
Use as default | The settings are saved as presets. |