Referencing of Visualizations
Displaying Multiple Visualizations in One Visualization
Important
Visualizations can be nested at any depth by means of Frame. In order to use the Switch to any visualization frame selection type without any problems, a Frame must not contain more than 21 referenced visualizations.
You can reference other visualizations within a main visualization either in a Frame or a Tabs element, and then display them in the window pane of the element.
In the case of the Frame element, you can freely program which of the visualizations is displayed at which time. One option is to use the switch frame variable of the Frame element, which automatically triggers a switch according to its value. You can also program additional controls which, after user input, trigger input actions that result in switching a visualization.
Moreover, you can use the Tabs to reference visualizations. It is easy and advantageous that the Tabs element provides preconfigured control of the visualization switch.
For more information, see: Configuring User Inputs

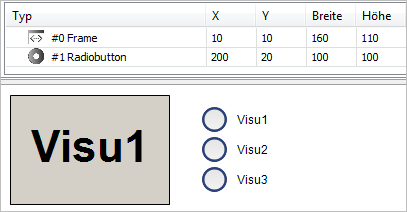
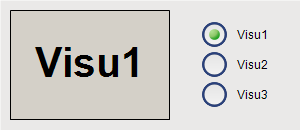
In the main visualization, the Frame element displays one of the referenced frame visualizations at runtime. The user can select the Radio Buttons element which is displayed in the frame.
Create a new standard project in CODESYS.
Select the application in the device tree and click .
In the Add Visualization dialog, specify the name
VisuMainand click Add to close the dialog.Select the application in the device tree and click .
In the Add Visualization dialog, specify the name
Visu1and click Add to close the dialog.Select the application in the device tree and click .
In the Add Visualization dialog, specify the name
Visu2and click Add to close the dialog.Select the application in the device tree and click .
In the Add Visualization dialog, specify the name
Visu3and click Add to close the dialog.In addition to the main visualization, there are three more visualization objects.
Open the
Visu1object.In the Visualization Toolbox, in the Basic category, select and drag the Radio Buttons element to the visualization editor.
The Properties view of the element opens.
Configure the properties of the rectangle as follows:
Texts, Text property:
Visu1Text properties, Font property: Title
Colors, Normal state, Fill color property: Light gray
Program the object
Visu2accordingly.. Properties of the rectangle:Texts, Text property:
Visu2Text properties, Font property: Title
Colors, Normal state, Fill color property: Gray
Program the object
Visu3accordingly.. Properties of the rectangle:Texts, Text property:
Visu3Text properties, Font property: Title
Colors, Normal state, Fill color property: Dark gray
Open the
VisuMainobject.In the Visualization Toolbox, in the Basic category, select and drag the Frame element to the visualization editor.
The Frame Configuration dialog opens.
In the Available Visualizations window area, on the By Visualization Name tab, select the object
Visu1. In Selected Visualizations, click Add.Then select the object
Visu2and click Add in Selected Visualizations.Then select the object
Visu3and click Add in Selected Visualizations.Click OK to close the dialog.
Now the Frame element references the three selected visualizations. The references (1) are listed in the References property in the element properties of the Frame element. In addition to the visualization name, the corresponding index value (2) is also displayed.
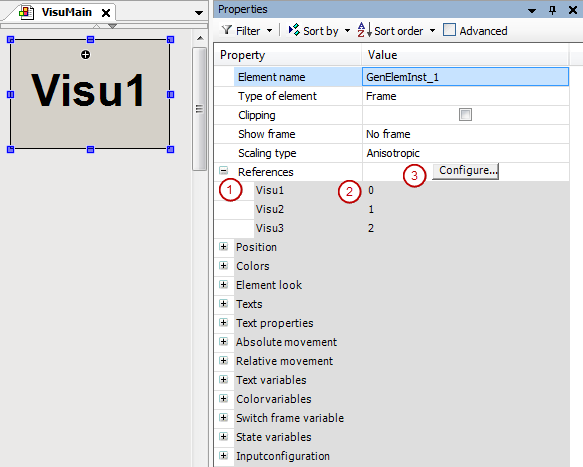
Note: You can open the dialog when you click the Configure button in the value field of the References property. See (3). You can influence the index by means of the visualization order in the Selected Visualizations list.
In the Visualization Toolbox, in the Common Controls category, drag the Radio Buttons element to the visualization editor.
The Properties view of the element opens.
In the Radio button settings, Radio button, click the Create new button.
This element has three switches to select from.
Configure the properties of the radio button as follows:
Radio button settings, Areas, [0], Text property:
Visu1Radio button settings, Areas, [1], Text property:
Visu2Radio button settings, Areas, [2], Text property:
Visu3
In the
PLC_PRGprogram, declare a local variable for the number of the visualization that is active.VAR iActiveVisu : INT; // Index of visu activated by the user END_VARSelect the Radio Buttons element and in the value field of the Variable property, click the
 button.
In the Input Assistant dialog, select the recently declared variable. Then exit the dialog.
. Property of the Radio Buttons element:Variable:
PLC_PRG.iActiveVisu
Select the Frame element. Click in the value field of the Switch frame variable, Variable property. Specify the recently declared variable here as well.
. Property of the Frame element:Switch frame variable , Variable property:
PLC_PRG.iActiveVisu
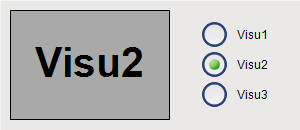
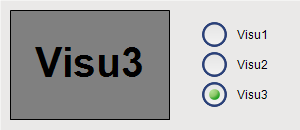
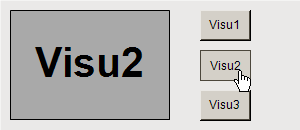
The control variable of the Radio Buttons element is also the switch frame variable of the Frame element. User input for the Radio Buttonselement switches the frame visualization.
Click .
Click and start the application.
The visualization starts. One of the referenced visualizations is running in the frame. When you click an unselected option of the Radio Buttons element, the visualization switches the contents in the frame to the desired visualization.
In the example, the switch frame variable is connected to an input variable. Instead, you can also set the switch frame variable programmatically in the IEC code.
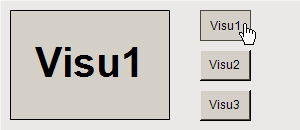
In the main visualization, the Frame element displays one of the frame visualizations at runtime. The user can use buttons to control the display in the frame. The user input triggers the Switch frame visualization input action.
Create a new standard project in CODESYS.
Select the application in the device tree and click .
In the Add Visualization dialog, specify the name
VisuMainand click Add to close the dialog.Select the application in the device tree and click .
In the Add Visualization dialog, specify the name
Visu1and click Add to close the dialog.Select the application in the device tree and click .
In the Add Visualization dialog, specify the name
Visu2and click Add to close the dialog.Select the application in the device tree and click .
In the Add Visualization dialog, specify the name
Visu3and click Add to close the dialog.In addition to the main visualization, there are three more visualization objects.
Open the
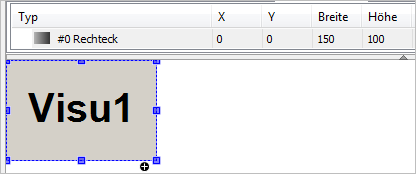
Visu1object.In the Visualization Toolbox, in the Basic category, select and drag the Rectangle element to the visualization editor.
The Properties view of the element opens.
Configure the properties of the rectangle as follows:
Texts, Text property:
Visu1Text properties, Font property: Title
Colors, Normal state, Fill color property: Light gray
Program the object
Visu2accordingly.. Properties of the rectangle:Texts, Text property:
Visu2Text properties, Font property: Title
Colors, Normal state, Fill color property: Gray
Program the object
Visu3accordingly.. Properties of the rectangle:Texts, Text property:
Visu3Text properties, Font property: Title
Colors, Normal state, Fill color property: Dark gray
Open the
VisuMainobject.In the Visualization Toolbox, in the Basic category, select and drag the Frame element to the visualization editor.
The Frame Configuration dialog opens.
In the Available Visualizations window area, on the By Visualization Name tab, select the object
Visu1. In Selected Visualizations, click Add.Then select the object
Visu2and click Add in Selected Visualizations.Then select the object
Visu3and click Add in Selected Visualizations.Click OK to close the dialog.
Now the Frame element references the three selected visualizations. The references (1) are listed in the References property in the element properties of the Frame element. In addition to the visualization name, the corresponding index value (2) is also displayed.
Note: You can open the dialog independently when you click the Configure button in the value field of the References property. See (3). You can influence the index by means of the visualization order in the Selected Visualizations list.
In the Visualization Toolbox, in the Common Controls category, drag the Button element to the visualization editor.
The element is selected and its properties are visible in the Properties view.
Configure the Texts, Text property with
Visu1.In the Input configurationOnMouseDown property, click Configure.
The Input Configuration dialog opens.
Select the Switch frame visualization action and click
 .
.The action is displayed in the window on the right.
- . Configure the action:
Select the Switch local visualization option.
Set the Visualization selection to
Visu1.Click OK to exit the dialog.
The follow-up action is configured in the Input configuration property.
Input configuration, OnMouseDown, Switch frame visualization property:
0 Drag another Button element to the visualization editor. Configure the button accordingly.
. Properties of the button:Texts, Text property:
Visu2Input configuration, OnMouseDown, Switch frame visualization property:
1
Drag another Button element to the visualization editor. Configure the button accordingly.
. Properties of the button:Texts, Text property:
Visu3Input configuration, OnMouseDown, Switch frame visualization property:
2
Click .
Click for the device and start the application.
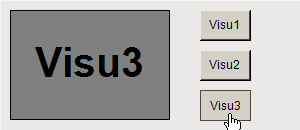
The visualization starts. One of the referenced visualizations is running in the frame. When you click one of the buttons, the visualization switches the contents in the frame to the respective visualization.
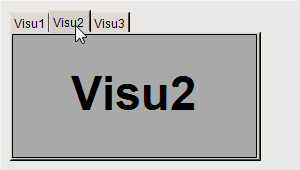
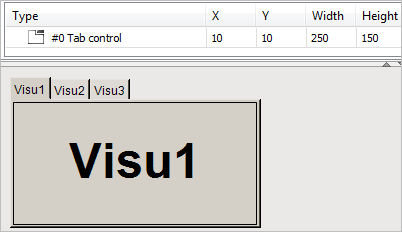
For the Tabs, the navigation of the referenced visualizations is provided automatically. The first of the referenced visualizations is in the foreground, while the others are hidden "behind it". The user can navigate between them by means of the tabs which are provided automatically.
Create a new standard project in CODESYS.
Select the application in the device tree and click .
In the Add Visualization dialog, specify the name
VisuMainand click Add to close the dialog.Select the application in the device tree and click .
In the Add Visualization dialog, specify the name
Visu1and click Add to close the dialog.Select the application in the device tree and click .
In the Add Visualization dialog, specify the name
Visu2and click Add to close the dialog.Select the application in the device tree and click .
In the Add Visualization dialog, specify the name
Visu3and click Add to close the dialog.In addition to the main visualization, there are three more visualization objects.
Open the
Visu1object.Drag a Rectangle element to the visualization editor.
The Properties view of the element opens.
Configure the properties of the rectangle as follows:
Texts, Text property:
Visu1Text properties, Font property: Title
Colors, Normal state, Fill color property: Light gray
Program the object
Visu2accordingly.. Properties of the rectangle:Texts, Text property:
Visu2Text properties, Font property: Title
Colors, Normal state, Fill color property: Gray
Program the object
Visu3accordingly.. Properties of the rectangle:Texts, Text property:
Visu3Text properties, Font property: Title
Colors, Normal state, Fill color property: Dark gray
Open the
VisuMainobject.In the Visualization Toolbox, in the Basic category, select and drag the Frame element to the visualization editor.
The Frame Configuration dialog opens.
In the Available Visualizations window area, on the By Visualization Name tab, select the object
Visu1. In Selected Visualizations, click Add.Then select the object
Visu2and click Add in Selected Visualizations.Then select the object
Visu3and click Add in Selected Visualizations.Click OK to exit the dialog.
Now the Tabs element references the three selected visualizations. The references (1) are listed in the References property in the element properties of the Frame element. In addition to the visualization name, the corresponding index value (2) is also displayed.
Note: You can open the dialog Frame Configuration dialog independently when you click the Configure button in the value field of the References property. See (3). You can influence the index by means of the visualization order in the Selected Visualizations list.
In the Visualization Toolbox, in the Common Controls category, drag the Tabs element to the visualization editor.
The Properties view of the element opens.
Configure the properties of the tab as follows:
Tab width property:
40References,
Visu1, Header property:Visu1References,
Visu2, Header property:Visu2References,
Visu3, Header property:Visu3
Click .
Click for the device and start the application.
The visualization starts. One of the referenced visualizations is running in the Tabs element. Click the tab to switch to the respective visualization.