Creating a Visualization with an Alarm Table
In the following instructions, the Alarm Table visualization element is configured as an example.
For more information, see the following: Defining an Alarm Group and Alarms
Configuration
Requirement: The AG_PartsShortage alarm group and the AC_PartsShortage alarm class are defined in your project.
Add a visualization below your application.
Select the application and click the Add Object → Visualization command.
Specify the name as
VIS_PartsShortage.
Open the visualization editor.
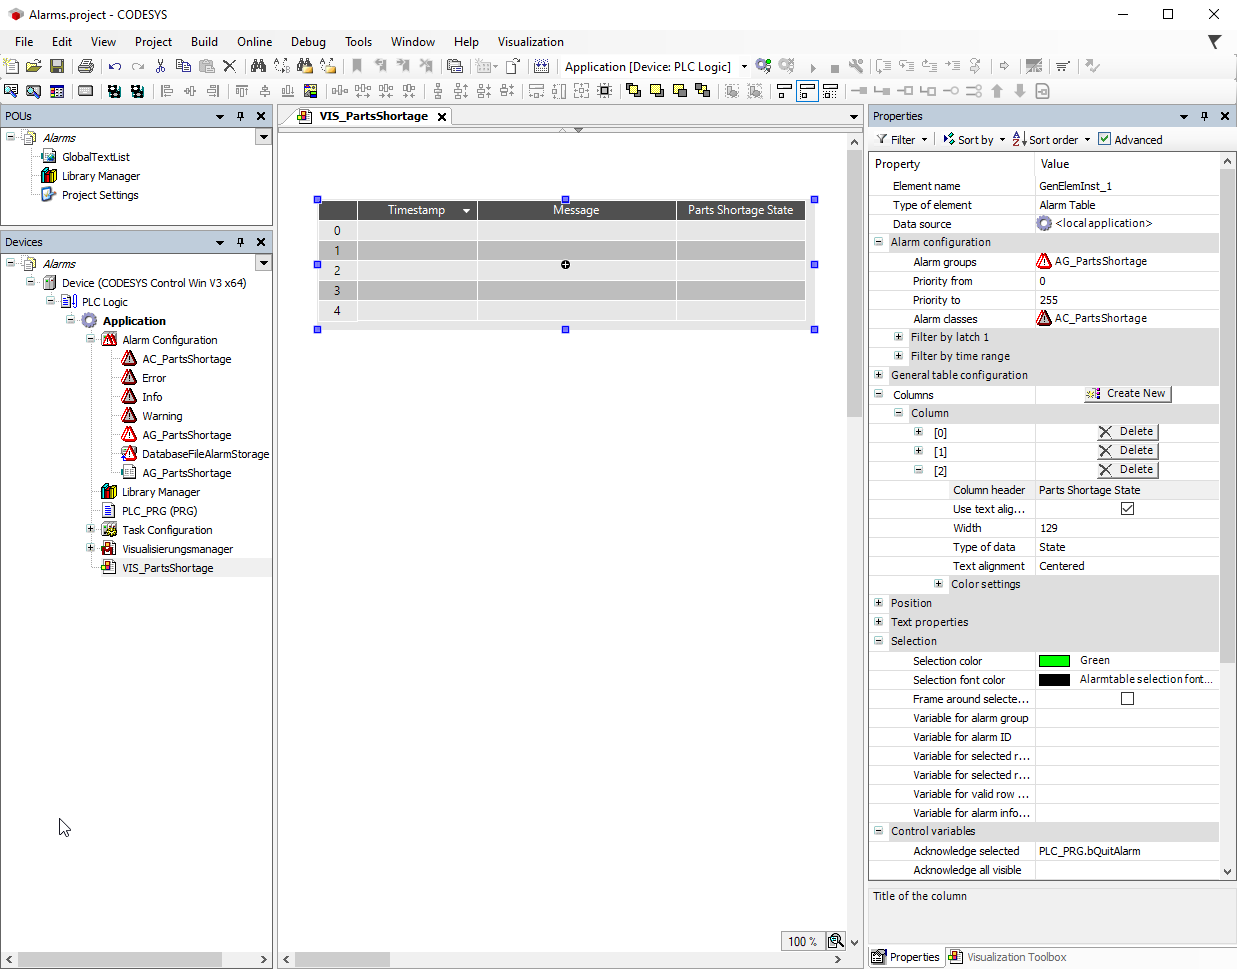
Drag the Alarm Table element from the Alarm Manager category into the visualization editor and open the properties view of the element.
Configure the alarm table as follows.
In the Element name property, in the Value column, specify the name
AT_PartsShortage.Configuration of the
Alarm groupsvisualization element property:In the Alarm configuration → Alarm groups property, click in the corresponding value cell.
The Selected Alarm Group dialog opens.
Clear the All option and select the
AG_PartsShortagealarm group.Click the
 button to add the group to the Selected Alarm Group list.
Click OK to confirm the configuration.
Configuration of the Alarm classes visualization element property:
In the Alarm configuration → Alarm classes property, define the alarm classes which you want to visualize. Click into the value field.
In the Alarm configuration → Alarm classes property, click in the corresponding value cell.
The Select Alarm Class dialog opens.
Clear the All option and select the
AC_PartsShortagealarm class.Click the
button to add the alarm class to the selected alarm classes.Click OK to confirm the configuration.
Configuration of a column:
In the Columns property, click the Create New button.
Column [2] is available. The new column with the name
Bitmapis listed in the visualization editor.In the Type of data property, select the State value for column [2].
In the table, the column is given the new default heading
State.In the Column header property, specify the name
Parts Shortage State.Column [2] is renamed.
Configuration of the Selection visualization element property:
In the Selection color property, select the color
Greenin the Value column.At runtime, the table cells can be selected by the visualization user. These then turn green.
Configuration of the Control variables visualization element property:
In your application code, declare the
bQuitAlarmcontrol variable.In the Acknowledge selected property, specify the
PLC_PRG.bQuitAlarmvariable in the value cell.
Configured properties
Supplementing an alarm visualization with controls
The visualization user needs controls to operate the alarm visualization. When programming, you can get support from the Alarm Table Wizard. The command which calls the wizard is available only when you have selected an alarm table in the visualization.
In the visualization editor, select the alarm table
element.In the context menu, click the Insert Elements for Alarm Acknowledgement command.
The Alarm Table Wizard dialog opens.
Click OK to accept all settings.
The
Acknowledge selected,Acknowledge all visible,History, andFreeze scrolling positionbuttons are added. The elements have a complete input configuration.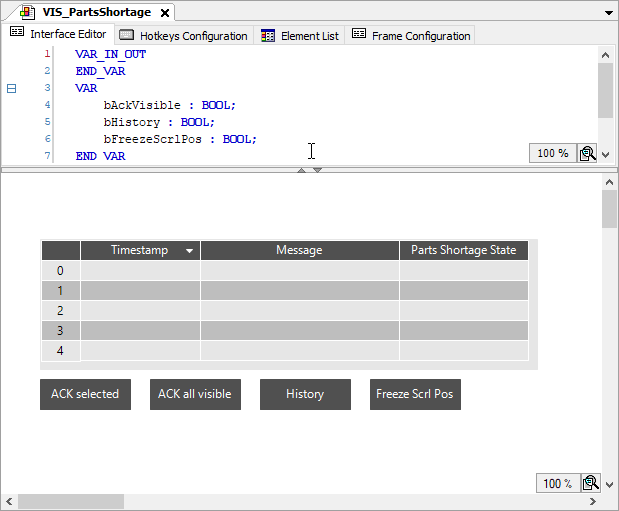
Evaluating Alarm Information in the Program Code
The Alarm Table visualization element can write information from the visualization to an application variable at runtime. This variable can be evaluated programmatically.
You get information about an alarm (for example: alarm group, alarm ID, timestamp of state transitions, latch variables, message texts) from the structure AlarmSelectionInfo (VisuElemsAlarm library).
To do this, in the Selection – Variable for information about selected alarm property of the alarm table, specify a variable of type AlarmSelectionInfo. Then use the variable in the application as follows:
Add a new
PRG_VISUPOU.Add the
PRG_VISUPOU toVISU_TASK.Open the
PRG_VISUPOU in the editor and insert the following program lines.Declaration
PROGRAM PRG_VISU
VAR
    alarmSelectionInfoDefault : AlarmSelectionInfoDefault;
    sLastTimestampDate : STRING;
    sLastTimestampTime : STRING;
    sLatch1 : STRING;
    sLatch2 : STRING;
    wsMessage1 : WSTRING := "No selection";
    wsMessage2 : WSTRING := "No selection";
    pInt : POINTER TO INT;
    xInit: BOOL := TRUE;
    pString : POINTER TO STRING;
    cbsFormattedValueLatch1 : CharBufferString(uiBufferSize := 0, stringType := TYPE_CLASS.TYPE_STRING);
    cbsFormattedValueLatch2 : CharBufferString(uiBufferSize := 0, stringType := TYPE_CLASS.TYPE_STRING);
    abyLocalBufferLatch1 : ARRAY[0..LENGTH] OF BYTE;
    abyLocalBufferLatch2 : ARRAY[0..LENGTH] OF BYTE;
    iPrevSelectionChangedCounter: INT;
    END_VAR
VAR CONSTANT
    // The length of the string of the local CharBufferString instance
    LENGTH : INT := 80 * 2;
END_VAR
Implementation
IF xInit THEN
    cbsFormattedValueLatch1.Init(pBuffer:=ADR(abyLocalBufferLatch1), uiBufferSize:=INT_TO_UINT(LENGTH + 1), stringType:=TYPE_CLASS.TYPE_STRING);
    cbsFormattedValueLatch2.Init(pBuffer:=ADR(abyLocalBufferLatch2), uiBufferSize:=INT_TO_UINT(LENGTH + 1), stringType:=TYPE_CLASS.TYPE_STRING);
    xInit := FALSE;
END_IF
IF alarmSelectionInfoDefault.AlarmSelectionInfo.iSelectionChangedCounter <> iPrevSelectionChangedCounter THEN
    // Format Date/Time as string
    sLastTimestampDate := AlarmManager.FormatDate(alarmSelectionInfoDefault.AlarmSelectionInfo.timeStampLast, AlarmManager.AlarmGlobals.g_sDateFormat);
    sLastTimestampTime := AlarmManager.FormatTime(alarmSelectionInfoDefault.AlarmSelectionInfo.timeStampLast, AlarmManager.AlarmGlobals.g_sTimeFormat);
    // Retrieve latch variables as string
    cbsFormattedValueLatch1.FromString('');
    pString := FormatTypedValue(alarmSelectionInfoDefault.AlarmSelectionInfo.paLatchVariables^[0], cbsFormattedValueLatch1);
    STU.StrCpyA(ADR(sLatch1), SIZEOF(sLatch1), pString);
    cbsFormattedValueLatch2.FromString('');
    pString := FormatTypedValue(alarmSelectionInfoDefault.AlarmSelectionInfo.paLatchVariables^[1], cbsFormattedValueLatch2);
    STU.StrCpyA(ADR(sLatch2), SIZEOF(sLatch2), pString);
    // Retrieve messages
    STU.StrCpyW(ADR(wsMessage1), SIZEOF(wsMessage1), alarmSelectionInfoDefault.AlarmSelectionInfo.papwsAlarmMessages^[0]);
    STU.StrCpyW(ADR(wsMessage2), SIZEOF(wsMessage2), alarmSelectionInfoDefault.AlarmSelectionInfo.papwsAlarmMessages^[1]);
    iPrevSelectionChangedCounter := alarmSelectionInfoDefault.AlarmSelectionInfo.iSelectionChangedCounter;
END_IF