Licensing
In addition to the general licensed software metrics, additional metrics are defined for the CODESYS Visualization add-on. These metrics are checked during download.
Important
The CODESYS Visualization metrics are calculated during compile and the current value is displayed in the editor only afterwards.
The determined values refer to one application. When multiple applications exist, the values of the individual applications are added up.
Calculation of the software metrics
Hint: First select your device and click the Edit Object command. In the device editor, select the Software Metrics for license determination tab. The current software metrics are displayed there quantitatively. The metrics of the CODESYS Visualization add-on are also described here.
Software metrics | |
|---|---|
| Value of the metric in number of visualization tags The number of visualization tags is the sum of the tags across all applications. The number of tags of an application is the sum of the tags across all visualization objects. The number of IEC variables and the number of visualization elements are added together for each visualization object. The visualization element also takes into account the type, which is weighted with a certain number of tags. The following table shows what is counted with how many tags. |

Tags in Visualization | Number of Tags |
|---|---|
Variable | For a scalar variable ( In the case of an array, each index is counted. In the case of structures. each variable in the structure is counted. A variable is counted only one time, even if it is used frequently in different visualizations. Local visualization variables and variables in the hotkey configuration are not counted. |
Trend, Trace, Histogram, Cartesian XY Chart | For each curve, 100 tags are counted. |
Table | For each cell, 1 tag is counted. All columns and only visible rows are taken into consideration. (number of tags = number of columns x visible cells) The cells of a template column are counted two times. (Use template option). |
Combo Box, Array | For the Variable and for Data array properties, 1 tag is counted. In addition, one tag is counted for each column in the array. |
Alarm Table, Alarm Banner | One tag is counted for each cell. All columns and only visible rows are taken into consideration. |
Frame | Frames are typically used with an interface. If a frame is used with different instances, then the variables of the instances which are used by the frame are counted. Constants are counted like variables when they are passed to interface variables. |
Dialogs | All dialogs which are opened by an input action are counted like a frame reference. System dialogs are counted with the following number of tags:
|
Native controls | All scalar variables are counted. |
HTML5 controls | All scalar variables are counted. Configured constants are counted like variables (colors, fonts, ...) If the type of the variable is Equation 1. |
Web Browser | All configured scalar variables are counted. In addition, there are 100 tags for the first used web browser element of an application. |
ActiveX | All configured scalar variables are counted. In addition, there are 100 tags for the first used ActiveX element of an application. |
HTML5 controls | All configured scalar variables are counted. In addition, there are 100 tags for the first used HTML5 control of an application. |
Display software metrics (visualization license) as text
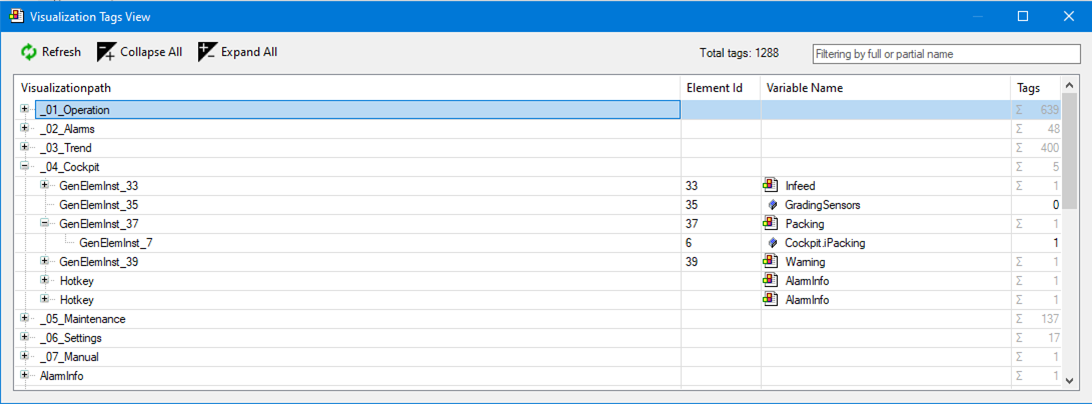
The Visualization Tags View dialog gives you detailed information about the variables used for the visualization in the project, the determined number of tags, and the call position as the visualization path. These were used for the Number of visualization tags software metric based on your application.
Visualization Tags View
Provides a detailed overview of the counted tags
Lists variables (tags) which are used in a specific visualization
Displays the call position as a visualization path
For more information, see the following: Visualization Tags View
Filter function
The visualization tags view with the Filtering by full or partial name filter function supports you with the following tasks and questions:
Where does a visualization object (template) occur?
Example 2. ExampleFiltering by the call locations of the visualization object
The
SE_Infeedvisualization is used in the_06_Settingsvisualization. And the_06_Settingsvisualization is called in theVisualizationvisualization.
Where does a tag (variable) occur?
Example 3. ExampleFiltering by the call locations of a tag (variable)
The
Settings.iDirectiontag (variable) is used in theSE_Infeedvisualization.