Accessing All Traces on the Controller
If the controller supports the runtime component CmpTraceMgr (Trace Manager), then you can access all traces from a CODESYS project which are running on the controller. In addition to application-related traces that capture the values of IEC variables, these can also be strictly controller-specific traces (for example, for recording device signal values or the CPU load).
For each trace running on the controller that you want to present in your project, you have to insert an individual DeviceTrace object in the device tree.
In order to show a trace from the device in this object, the connection to the PLC has to be configured correctly (Communication Settings). Then use one of the following menu commands:
: Establishes the connection to the PLC and opens the Online List dialog for selecting a trace from the controller
: Available in online mode only; also opens the Online List dialog
Now the trace uploaded from the controller can be started and traced in the editor of the DeviceTrace object. The configuration of the presentation (colors, labels, etc.) is the same as with traces for application variables configured in the project.
Closing the DeviceTrace editor terminates the connection to the controller.
Note that the connection to the controller is also terminated when the last open DeviceTrace editor is closed. In order for device traces to be displayed again in the project, you have to reload them into the DeviceTrace objects.
Currently, closing the editor is also the recommended way to deliberately terminate the connection to the controller. Logging out is not enough for this.
Displaying the CPU load with DeviceTrace objects in the CODESYS project (example)
Requirement: The PLC device supports the Trace Manager. For the example described here, this is CODESYS Control Win. The device provides traces of the individual CPU loads (CpuLoad), as well as traces of the CPU load caused by the runtime (PlcLoad). The possible display of the CPU load in the project can be helpful when using multicore functionality.
In the project, define the Communication Settings for the controller.
Select the PLC entry in the device tree and add a DeviceTrace object.
Rename DeviceTrace to "Trace_PlcLoad" (Properties).
Set the focus in the trace editor and click .
The connection to the controller is established and the Online List dialog opens.
In the dialog, select the PlcLoad entry and click Upload. Click OK to close the dialog.
Multiple trace views open in the trace editor to show the CPU load in the runtime. These are the traces for the individual CPUs and a trace for the average value. The following text appears for each: "No samples have been recorded."
Click .
The trace record for the four parameters is displayed.
If you also want to display the traces for the
CpuLoadper CPU with their average value in the project, then insert another DeviceTrace object into the device tree. Name it "Trace_CpuLoad", for example. Load and start the traces for CpuLoad in the editor as described above.Now you can monitor all traces in the project:
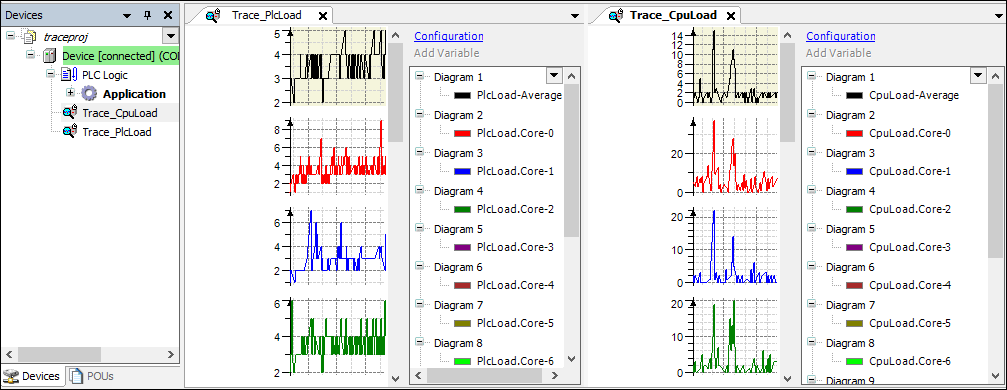
If you want to change the appearance of the presentation, then click Configuration in the respective trace editor window to access the configuration dialogs. You can use these dialogs (except variable assignments) in the same way as for an IEC variable trace created in a project.
To disconnect from the controller, close all open DeviceTrace editor windows. If you are logged in to the device, then logging out is enough to terminate the connection.