Object: Trace
Symbol: 
An object of type Trace is used to configure and display application-specific trace data in one or more charts. At application runtime, value curves of trace variables, which you can monitor in the trace editor in CODESYS during this time, are recorded on the controller. Requirements are that a trace configuration has been configured transferred to the controller, and the trace recording has been started. The sampled data is transmitted to the development system and displayed in charts according to the configuration. You can navigate through the data when tracing.
For more information see: Data Sampling with Trace
Tip
If the controller supports a Trace Manager, then you can use the 'DeviceTrace' object type in the Trace Manager to access all traces that are running on the controller.
Double clicking the trace object opens the trace editor. The corresponding toolbar contains the most important trace commands. The trace variable list shows the variable whose value curve is recorded.
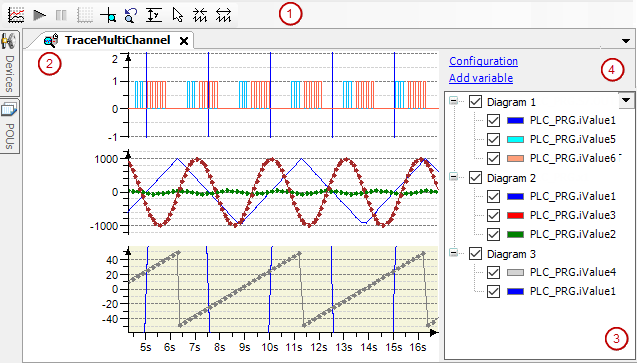
(1): Toolbar of the trace editor
(2): Trace editor
(3): Trace variable list
(4): Links for trace configuration
Configuration
Add Variable
Toolbar of the trace editor


Trace editor
At application runtime, the runtime system buffer of the trace component is filled with the recorded samples. The data is transmitted to the development system and stored in its trace editor buffer. The trace editor accesses this data and displays it in charts as a graph over time. When you close the trace editor, the trace editor buffer is freed up again.
For more information, see: Control the Data Sampling
Use menu commands to control the trace. Moreover, you can use menu commands, keyboard shortcuts, and mouse input to navigate through the data.
For more information, see: Navigating into Trace Data
Trace variable list
The trace variable list provides an overview of the current trace configuration. In the list, all charts with the respective trace variables are displayed in a table. When you double-click a trace variable, the Trace Configuration dialog also opens with the variable settings.
 | The list box opens by means of the Hide Instance Paths command. |
Hide Instance Paths | Display of the variable name in the list
Example: |

Tabular display of the charts | |
Name | List of charts with the respective variables
When you select a Chart <n> in the table, the corresponding chart is also selected in the editor. This also works the other way around. |
Cursor <n> | Y-value at the cursor position |
Delta | Delta of the Y-value from Cursor 2 to Cursor 1 |
Multiselection | With multiselection, you can use the numpad keys * and / to expand and collapse selected charts. |

Tip
You can drag the charts and variables to sort them or move them to other charts. When the Ctrl key is pressed, the variable is copied. This is also possible in online mode.
Add Variable | Adds a new trace variable and opens the Trace Configuration dialog with its variable settings Select a variable in the input field of the Variable setting to trace its value curve. |
Visible | Toggles the visibility of the graph (value curve or trace variable) in the corresponding diagrams:
When multiple charts or variables are selected in the trace variable list by multiselection, the visibility can be toggled for these graphs. |
Display Mode | Opens the Trace Configuration dialog Select a configuration item in the Trace Record tree view or Presentation (Diagrams). |
Configuration | Opens the Trace Configuration dialog The Variable Settings are displayed on the right side. |


Navigating in the trace diagram
User Input with Mouse | Mouse cursor symbol during user input | Effect |
|---|---|---|
Drag the graph along the X-axis. |  | Scrolls trace graphs of all charts at the same time along the time axis (X-axis) |
Hold down the Ctrl key and drag the graphs along the Y-axis. |  | Scrolls the trace graphs of the selected charts along the Y-axis |
Roll the mouse wheel backwards. | Compresses the time axis (like the | |
Roll the mouse wheel forwards. | Stretches the time axis (like the | |
Press and hold down the Ctrl key and roll the mouse wheel backwards. | Compresses the Y-axis | |
Press and hold down the Ctrl key and roll the mouse wheel forwards. | Stretches the Y-axis | |
Requirement: One or two trace cursors are activated. Drag the triangle of a trace cursor to another position along the time axis. |  | Refreshes the Y-values in the trace variable list at the same time
|
Requirement: Mouse zooming is activated ( Stretch a rectangle. |  | Zooms the trace graphs of all charts to the rectangle |

Keyboard Shortcut | Effect |
|---|---|
Requirement: No trace cursor mode is activated. Arrow Left Arrow Right | Scrolls trace graphs of all charts at the same time along the time axis |
Arrow Up Arrow Down | Scrolls the trace graphs of the selected charts along the Y-axis |
Requirement: One or two trace cursors are activated. Alt+Arrow Left Alt+Arrow Right | Scrolls trace graphs of all charts at the same time along the time axis |
- | Compresses the time axis (like the |
+ | Stretches the X-axis (like the |
Ctrl+- | Compresses the Y-axis of the selected chart |
Ctrl++ | Stretches the Y-axis of the selected chart |
Tab | Selects the next lower chart |
Requirement: One or two trace cursors are activated. Arrow Left Arrow Right | Moves the black trace cursor |
Requirement: Two trace cursors are activated. Shift+Arrow Left Shift+Arrow Right | Moves the gray trace cursor |