Dialog: Advanced Trend Settings
Function: The dialog provides advanced settings for data sampling.
Call: Trace Configuration dialog, Record Settings subdialog, Advanced button
Requirement: The trace editor is open and active. The Trace Configuration dialog is open and the top node of the trace record tree is selected so that the Record Settings subdialog is available.
Tip
For the calculation of the values, you have to select a task in the Trace Configuration dialog.
Options of the user interface | Description | Display of calculation results on the right next to each option |
|---|---|---|
Measurement in every n-th cycle | Data sampling in every n task cycle Default: | Sampling interval which is automatically calculated from the value specified in the Measurement in every n-th cycle option Example: |
Recommended runtime buffer size (samples) | Calculated automatically and therefore recommended number of samples which the application can store per trace variable at runtime This value determines the maximum ring buffer size in the runtime system. This buffer size is automatically calculated from the task cycle time and the value in the Measure in every n-th cycle option, and the displayed. This buffer size is used when the Override runtime buffer size option is disabled. | Maximum length of the time interval during which the application samples data on the runtime system Example: Note: The calculation is possible only when the settings of the trace configuration are set in the Trace Configuration dialog and therefore the task cycle time is known. |
Override runtime buffer size |
At runtime, the value which you have specified here is used, not the value displayed in the Recommended runtime buffer size (samples) option. Example: At least
| Maximum length of the time interval during which the application samples data on the runtime system without overwriting it Example: |
Trace editor buffer size per variable (samples) | Number of values which can be stored per variable in the trace editor Example: | The maximum time period for the display in the trace editor results from the maximum number and the sampling interval of the data sampling. You can scroll back a maximum of this time in the trace editor. |

Column (1) notifies you about the number of samples. Column (2) next to it displays the calculated time intervals which result.
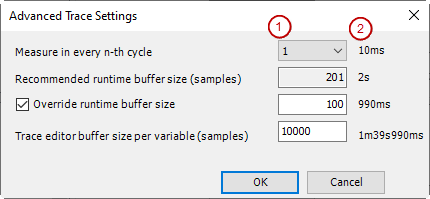
The information displayed in the example means that one sample is taken per task cycle in the runtime system and continuously cached in a ring buffer, which can hold a maximum of 201 samples. The enabled Override runtime buffer size option has the effect that, due to the ring buffer, the first cached values are first overwritten after 100 samples. During this time, 10000 samples are continuously displayed in the trace editor so that a value curve can be displayed over an interval of 1 minute and almost 40 seconds.
For more information, see: Creating Trace Configuration