Diagnosis Methods
For more information about troubleshooting, see the following views in CODESYS or external software, each depending on the case:
Status dialog in the device configurator
If the object of the PROFINET Controller or PROFINET Device has a red symbol in the device tree, or if no communication is taking place at all, then take a look at the Status tab in the device configuration dialog.
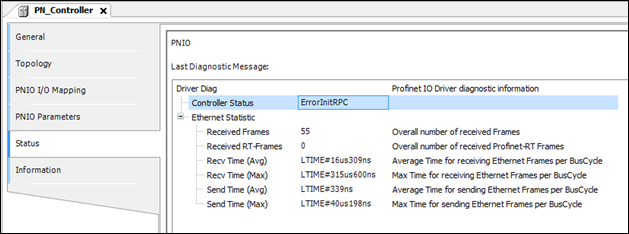
Here we are looking at the controller only. The same basically applies to the device.
The most important fields in the diagnosis structure displayed here are as follows:
Controller status:
Current status of the controller; the individual values correspond to the enumeration Profinet.ControllerState:
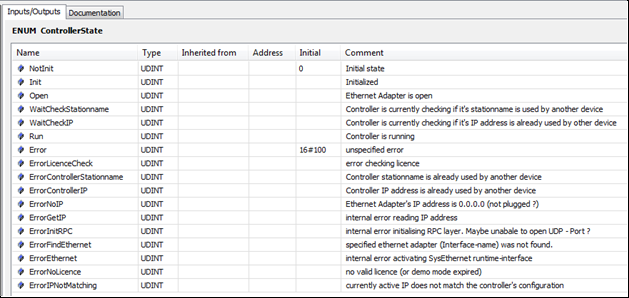
Specific conclusions about problem sources can often be drawn from these values, for example for license issues or doubled station names.
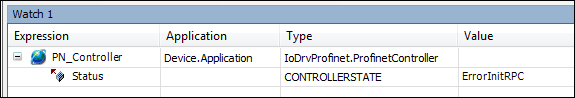
The status value is also available in the PLC application:
Received frames / Received RT frames:
Under specific conditions, the controller status switches to "Run", but communication is still not possible. The values Received frames / Received RT frames can provide more information:
Received frames shows the number of all Ethernet frames that were received over the Ethernet interface. Received RT frames shows the subset of the PROFINET RT frames.
If both counters remain at 0 after starting the controller although the device is in a network, then this indicates basic problems with the runtime component SysEthernet.
If only Received frames increments but not Received RT frames although PROFINET devices are in the network, then this indicates a problem with the runtime configuration (firewall, package filter, etc.).
Invalid Cyclic Frames:
When the counter increments, this indicates problems with the runtime component SysEthernet or the Ethernet driver. Received PROFINET frames are rejected as faulty. UDP/Ethernet adapters are often the cause. Use the internal Ethernet adapters of the system.
Send Errors:
The counter shows the failed attempts at sending data via the Ethernet adapter. When the value is > 1, this indicates problems with the runtime component SysEthernet or the Ethernet driver.
Recv Time / Send Time:
The maximum value and the average value are displayed here for both sending and receiving of the Ethernet frame. The values indicate the performance for the link to the Ethernet adapter (runtime interface SysEthernet).
Very high values (> 500 us) indicate a system overload or an interruption of the real-time behavior. Under some circumstances, this leads to unstable communication (connection interruption with DHT error). Only very long send intervals (> 8 ms) may be possible. For example, typical values for CODESYS Control RTE with 10 slaves and a 1ms send interval are 20–30 us, for Linux /ARM 200–300 us.
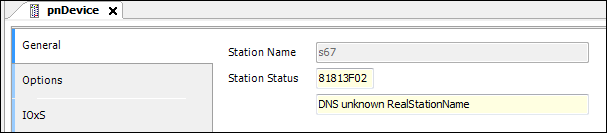
PROFINET Slave configurator
In the case of a failed connection (slave symbol is red), the cause is displayed in the General tab of the device configuration dialog. (PNIOStatus according to PI Specification: Application Layer protocol for decentralized periphery Technical Specification for PROFINET IO, Version 2.3Ed2MU2, Date: February 2015, Order No.: 2.722)
Task monitor (monitoring)
On weak systems or systems with a poor link to the Ethernet component (SysEthernet), connection disruptions can be caused by jitter or high cycle times.
This mainly affects the controller. The device is not critical in this case.
The Monitoring tab in the Task Configuration helps to detect these problems.

Important is the Profinet_IOTask in which the PROFINET RT data packages are transmitted in a fixed send clock. If this send clock cannot be maintained, then the connection is terminated by the communication watchdog "DataHoldTimer" of the PROFINET Devices.
As recommended values, the average cycle time should not exceed 250 µs and the maximum cycle time should not exceed 1 ms.
Therefore, the Profinet_IOTask should run as high priority, and other IEC tasks should not block the Profinet_IOTask (same or higher priority). In the context of this task, no blocking or long-lasting calls should occur.
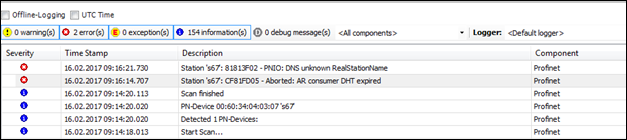
Log view of the PLC
In case of error in the configuration or an interruption of the connection, the PROFINET driver may provide more information in the log view of the device configurator of the PLC:
Wireshark
An established tool for network diagnostics in general is the free software (www.wireshark.org). This can be used for recording all network traffic on the port of the controller/device. Wireshark can also be installed on another device (for example, a Windows PC) as long as it is in the same network as the PROFINET participant. In this case, however, a switch must be used with a mirror port.