Monitoring
When your application is running on a controller or as a simulation and you open a programming object in the development system, the current values are displayed there. This allows you to monitor the runtime behavior of the POU.
Tip
There you can disable the inline monitoring function:
, in the Text editor category, on the Monitoring tab
For more information see: CODESYS Essentials: Monitoring of values
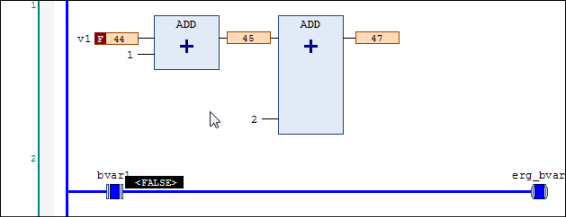
Display in networks
Connecting lines are displayed in color according to their actual Boolean values (blue means TRUE, black means FALSE).
Display in LD
In the online view of a ladder diagram (LD), the connecting lines are displayed in color: connections with the value TRUE are indicated by a thick blue line, connections with the value FALSE by a thick black line. In contrast, connections with an unknown or analog value are displayed normally (thin black line).
The contact and coil elements are also indicated.
For contacts and coils, a prepared value (TRUE or FALSE) is displayed in a small view next to the element.
Important
The value of the connections is calculated from the monitored variables. This is not a genuine flow control.
Display in IL
Current values are displayed in a separate column.