Example: Using the VisuTrendStorageAccess Library
Product: CODESYS Visualization
The TrendStorage API Example.project sample project uses a visualization to show how to use the VisuTrendStorageAccess library to read trend data works.
For more information about the trend element, see: Visualization Element: Trend
Description
In this example, trend data is saved by the trend recording manager and then read by the VisuTrendStorageAccess API using ST code. This allows for the retrieval of historical data. Moreover, the trend data can be exported.
Four tasks are defined in the TrendStorage API Example.project sample project.
The standard task calls the
PLC_PRGprogram in order to simulate data.The simulated data is are saved in a database by the
TrendRecordingTasktask and the "Trend Recording Manager" component.The
VISU_TASKtask is responsible for refreshing the visualization.The actual reading of trend data is done in the
Task200mstask, theTrendStorageAPI_TestProgprogram, and theTrendStorageReaderfunction block.
The ITrendStorageWriterListener interface is used for the active notification of new data.
For this purpose, the TrendStorageWriterListener function block implements the ITrendStorageWriterListener interface and is registered for the TrendStorageReader function block. When new data is saved, the DataWritten method is called with the start and end time stamps and the number of saved records.
The TrendStorageReader function block and the Read method are used to read records.
eError2 := instTrendStorageReader.Read(liTimstampFrom := liTimstampFrom2, liTimstampTo := liTimstampTo2,itfTrendStorageReaderConsumer := instTrendStorageReaderConsumer);
The TimeStampRead and ValueRead methods of instTrendStorageReaderConsumer are then automatically called for each value.
In the example, the TrendStorageReaderConsumer function block implements the ITrendStorageReaderConsumer interface and writes the values to the controller console in CSV format. If the size of the returned data would block the database for too long, then ETrendStorageReaderErrors.AdditionalReadCallRequired is returned as an error code. The read operation has to be continued at a later time by calling the ContinueReading method with the same parameters.
Additional information
Description of the visualization
The simulated signals are displayed in a trend element in the upper part of the visualization.
The minimum and maximum time stamps of the trend data are displayed on the "Min/Max Times" tab.
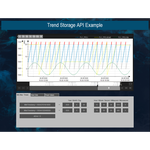
The current values of the
DataWrittenmethod are displayed in "New Data".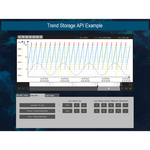
The values are read on the "Read Values" tab.
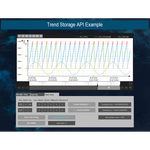
The start time stamp is displayed in the upper field and the end time stamp in the lower field.
The "Compute timestamps" button converts the specified data into the corresponding time stamp (reverse function: "Compute date/time"). Then the read operation can be started by clicking the "Read Trend Storage" button. Clicking "Stop reading" will cancel the read operation. When the "Detailed output" button is active, the data can be viewed on the logging page of the device. (Do not start CODESYS Control Win via SysTray.) Otherwise, the number of records is displayed in the "count rows" field.
System requirements and restrictions
Programming system | CODESYS Development System version 3.5.18.0 or higher |
Runtime system | CODESYS Control Win Version 3.5.18.0 or higher |
Add-on components | CODESYS Visualization version 4.8.0.0 or higher |
Note
 DOWNLOAD Project