Example: Using the OpenWeather Client SL Library
Product: CODESYS IIOT Libraries SL
The OpenWeather Client SL Example.project sample project shows how to use the OpenWeather Client SL library to query weather data via the OpenWeather API.
Preparation
In order to query data from the external OpenWeather API, you need to enter a valid API key. The "One Call API 3.0" service must be activated for this key. If you have already generated a key, then you do not need to perform any further preparatory steps.
If you do not yet have a key and want to create a new key or if you are unsure whether the required service has been activated for your key, then proceed as follows:
Create an account.
Create an account on the OpenWeather website or log in if you have already registered.
Generate a key.
When you are logged in, navigate to the
API keysmenu item. There you can view all active API keys and create new keys using theGeneratebutton.Activate the "One Call API 3.0" service.
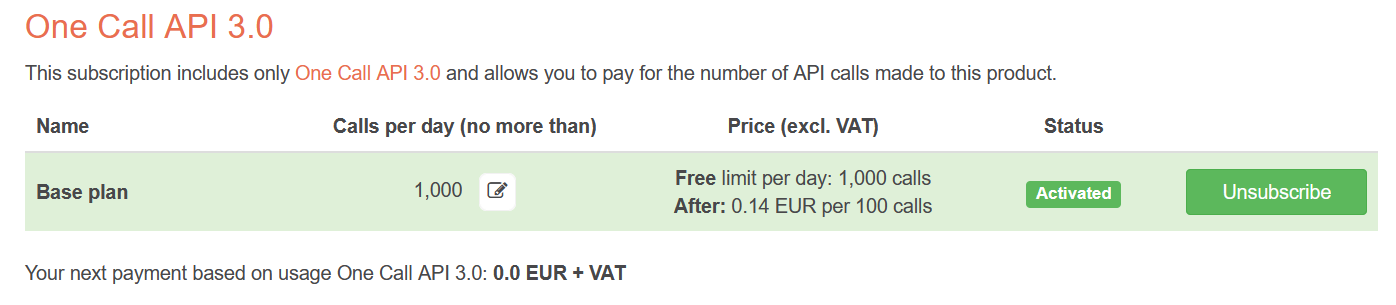
This service is required for the library to function correctly. Navigate to the
Billing Plansmenu item and search for the "One Call API 3.0" service.If you have not yet subscribed to this service, then you can do so by clicking on the
Subscribebutton. Now theStatusfield should beActivated.After this step, you should be able to see the following:
Optional: Set up a call limit.
If you only want to use the free daily quota, then you can set a limit to make sure that no more than 1000 calls can be made.
To do this, navigate to the
Billing Plansmenu item so that you can see the view shown above. In theCalls per daycolumn, you can define the maximum number of calls you want to allow per day.Done
Have your API key ready to run the example applications.
Description
General note about location information in the examples
In the examples, the location data (
GeoLocation) is defined statically in the declaration area of the respective main program of the application (here:CFC_PRG).You can change the values of this object to query weather data from other locations.
Note
Only the GPS coordinate in the format "Decimal Degree" (DD), which is defined by a longitude and latitude, actually influences the location for which the data is requested. Other information, such as the city name, has no effect.
You can get the coordinates for a location via a map service and enter the remaining information manually if necessary. Alternatively, you could also use the
GeoLocatorfunction blocks (seeGeoLocatorExamplesapplication) to correctly fill in theGeoLocationstructure.
Application: CurrentWeatherExample
In this application, current weather data for a specified location is requested from the OpenWeather API. In the sApiKey field, enter your API key and set the xLoadWeatherData flag to TRUE in order to fetch data. The data is loaded into the currentWeatherData structure. You can view the contents of the structure in the monitoring area.
Application: WeatherForecastExample
In this application, an hourly weather forecast for the next 48 hours for a specified location is requested from the OpenWeather API. In the sApiKey field, enter your API key and set the xLoadWeatherData flag to TRUE in order to fetch data. The data is loaded into the weatherForecast structure. You can view the contents of the structure in the monitoring area.
Application: CurrentWeatherAndForecastExample
In this application, the current weather and the hourly weather forecast for the next 48 hours for a specified location is requested from the OpenWeather API. In the sApiKey field, enter your API key and set the xLoadWeatherData flag to TRUE in order to fetch data. The data is loaded into the currentWeatherData and weatherForecast structures. You can view the contents of the structures in the monitoring area.
Important
The CurrentWeatherAndForecastExample function block could give the impression that it simply executes the CurrentWeather and ForecastWeather function blocks one after the other. That is not the case. The CurrentWeatherAndForecastExample function block can query the current weather data and forecast weather data in just one API call. It should therefore always be used when both types of data are required.
Application: GeoLocatorExamples
In this application, a location description – but above all the coordinates of a location – is requested from the OpenWeather Geocoding API.
In the sApiKey field, enter your API key and set the xLoad[...] flags to TRUE in order to fetch data. The data is loaded into the location structure. You can view the contents of the structure in the monitoring area.
Application: VisuExample
The application shows the query of the current weather and the weather forecast for the next 48 hours in connection with a visualization interface.
A visualization is a good way to get a quick overview of the available information.
User interface
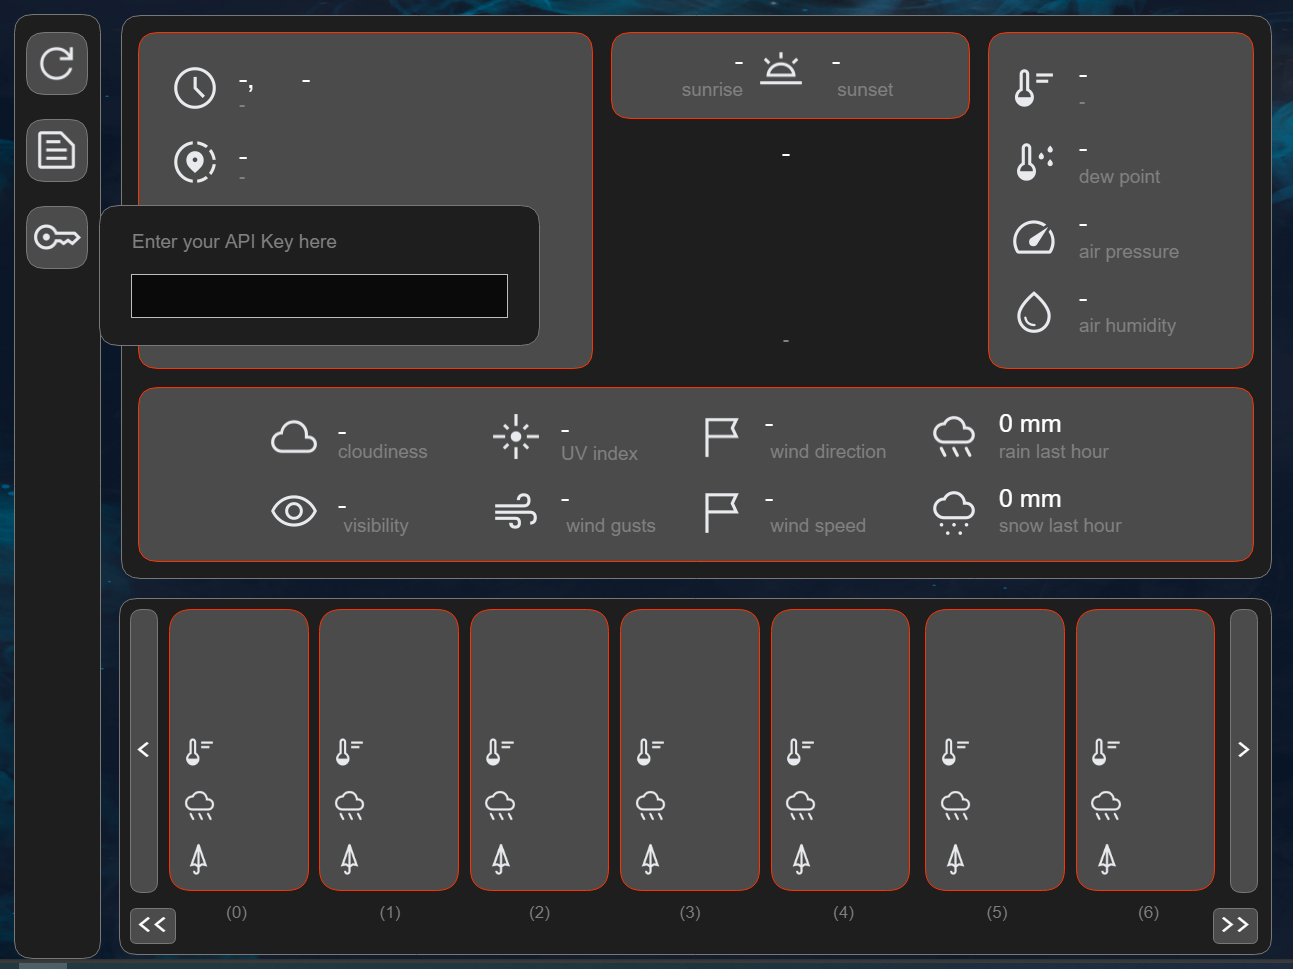
When you start the application, the following visualization window opens:
Control bar
You can use the control bar on the left side to control the application.
Click the
 button to fetch and display real data from the API server. Note that you need to set an API key for this. If clicking this button has no effect, then check the API key which you have entered.
Click the
 button to load dummy data which does not require an API call. This data is then loaded from a JSON file which contains a previous API response.
Click the
 button to show and hide the window where you enter your API key.
API key overlay
Clicking the
button will open the window to enter the API key. Click in the text field to enter or change your key.Display of the current weather
The top-center panel shows the current weather data. All available information is displayed. You can use a tooltip (hover over it with the mouse pointer) to display the description of the values which do not have a label on the interface.
Display of the weather forecast
The bottom-center panel shows the weather forecast. The information shown here has been reduced in order to get a clear display. Theoretically, almost all information is available for each entry which is also available for the current weather (except sunrise/sunset times).
Because the forecast for the next 48 hours contains a data point every hour, there are 48 panels to switch through.
Use the
 and
and  buttons to move the view of the 48 entries one entry to the left or right. Use the
  and
and  buttons to jump quickly to the start or end.
System requirements and restrictions
Programming system | CODESYS Development System (version 3.5.18.0 or higher) |
Runtime system | CODESYS Control Win (version 3.5.18.0) |
Add-on components | - |
Note
 DOWNLOAD projects